

Risk management
What Is Drawdown in Trading? Formula, Example, and Risk Controls
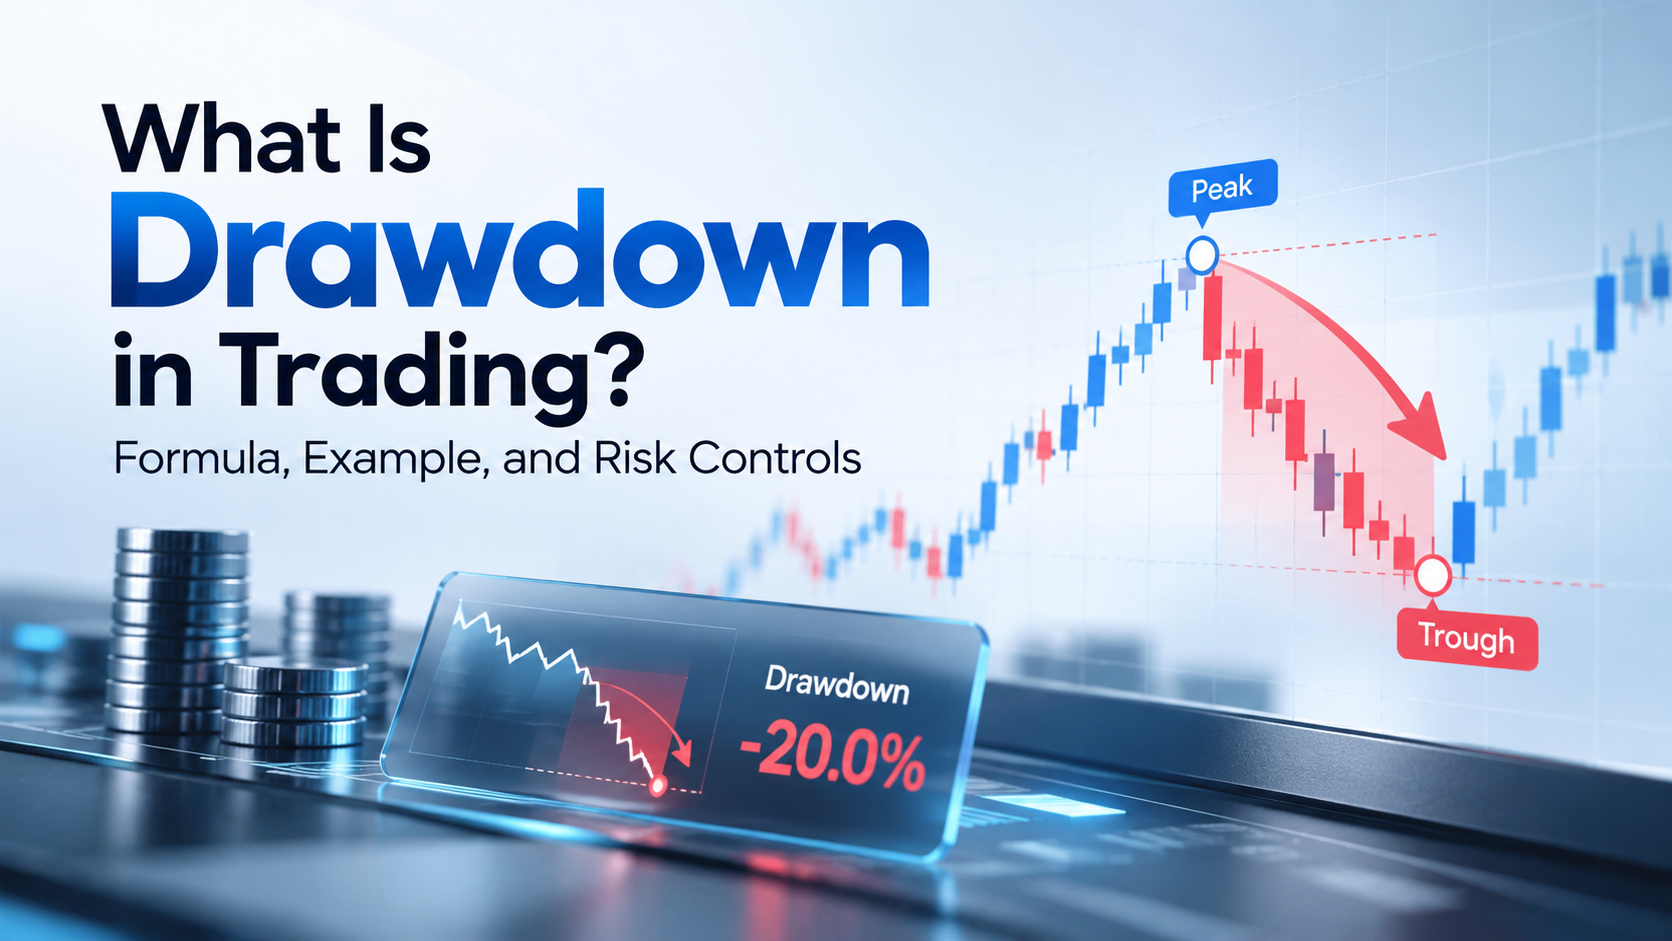
Drawdown in trading measures the decline in an account’s value from a previous peak to a subsequent low. Traders commonly express it as a percentage to understand how far their account value has declined from a previous peak. By tracking drawdown, traders can assess historical losses, compare trading strategies, and evaluate whether their risk-management rules are working as intended. However, drawdown measures past or current losses, not the maximum loss a future trade could produce.
What Does Drawdown Mean in Trading?
Drawdown is the reduction in trading account equity from a previous high to a later low. It can reflect realised losses from closed positions, unrealised losses on open positions, or both, depending on the measurement method.
For example, suppose an account reaches £10,000 and subsequently falls to £8,500. The account has experienced a drawdown of £1,500, equivalent to 15% of its peak value.
Drawdown is useful because the amount lost in currency alone does not show how severe a decline was relative to the capital available. A £1,500 loss represents 15% of a £10,000 account but only 3% of a £50,000 account.
Traders may measure drawdown over different periods or across an entire trading history. Therefore, any drawdown figure should identify its measurement basis, including the starting peak, the subsequent low, and whether the calculation uses account balance or equity.
How to Calculate Drawdown in Trading
The drawdown formula compares a previous peak with a subsequent trough. To calculate percentage drawdown, divide the decline by the peak value and multiply the result by 100.
Drawdown Formula:
Percentage Drawdown = [(Peak Value − Trough Value) ÷ Peak Value] × 100
The peak value represents the highest relevant account value before the decline. The trough value represents the lowest value reached after that peak during the measurement period.
Example: Calculating Percentage Drawdown
Consider a hypothetical trading account with the following values:
|
Measurement |
Value |
|
Previous account peak |
£12,000 |
|
Subsequent account trough |
£9,600 |
|
Drawdown in monetary terms |
£2,400 |
|
Percentage drawdown |
20% |
The calculation is:
Percentage Drawdown = [(£12,000 − £9,600) ÷ £12,000] × 100 = 20%
The account has therefore experienced a 20% drawdown from its previous peak.
This calculation does not mean that the account has lost 20% of its original deposit. The account might have increased or decreased before reaching the peak. Instead, the percentage measures the decline relative to the highest value used in the calculation.
Balance Drawdown vs Equity Drawdown
Balance and equity drawdown describe different aspects of an account’s performance.
· Balance drawdown: Measures the decline in the account balance, which generally reflects deposits, withdrawals, and realised trading results.
· Equity drawdown: Measures the decline in account equity, which generally includes the balance and the unrealised profit or loss on open positions, subject to the account provider’s calculation method.
For example, an account may have a balance of £10,000 while an open position has an unrealised loss of £500. Its equity would be £9,500 before other applicable adjustments. Consequently, equity drawdown can reveal a decline that the balance alone does not yet show.
When comparing trading performance, it is important to use consistent definitions. Otherwise, two drawdown figures may appear different simply because they measure different account values.
What Is Maximum Drawdown?
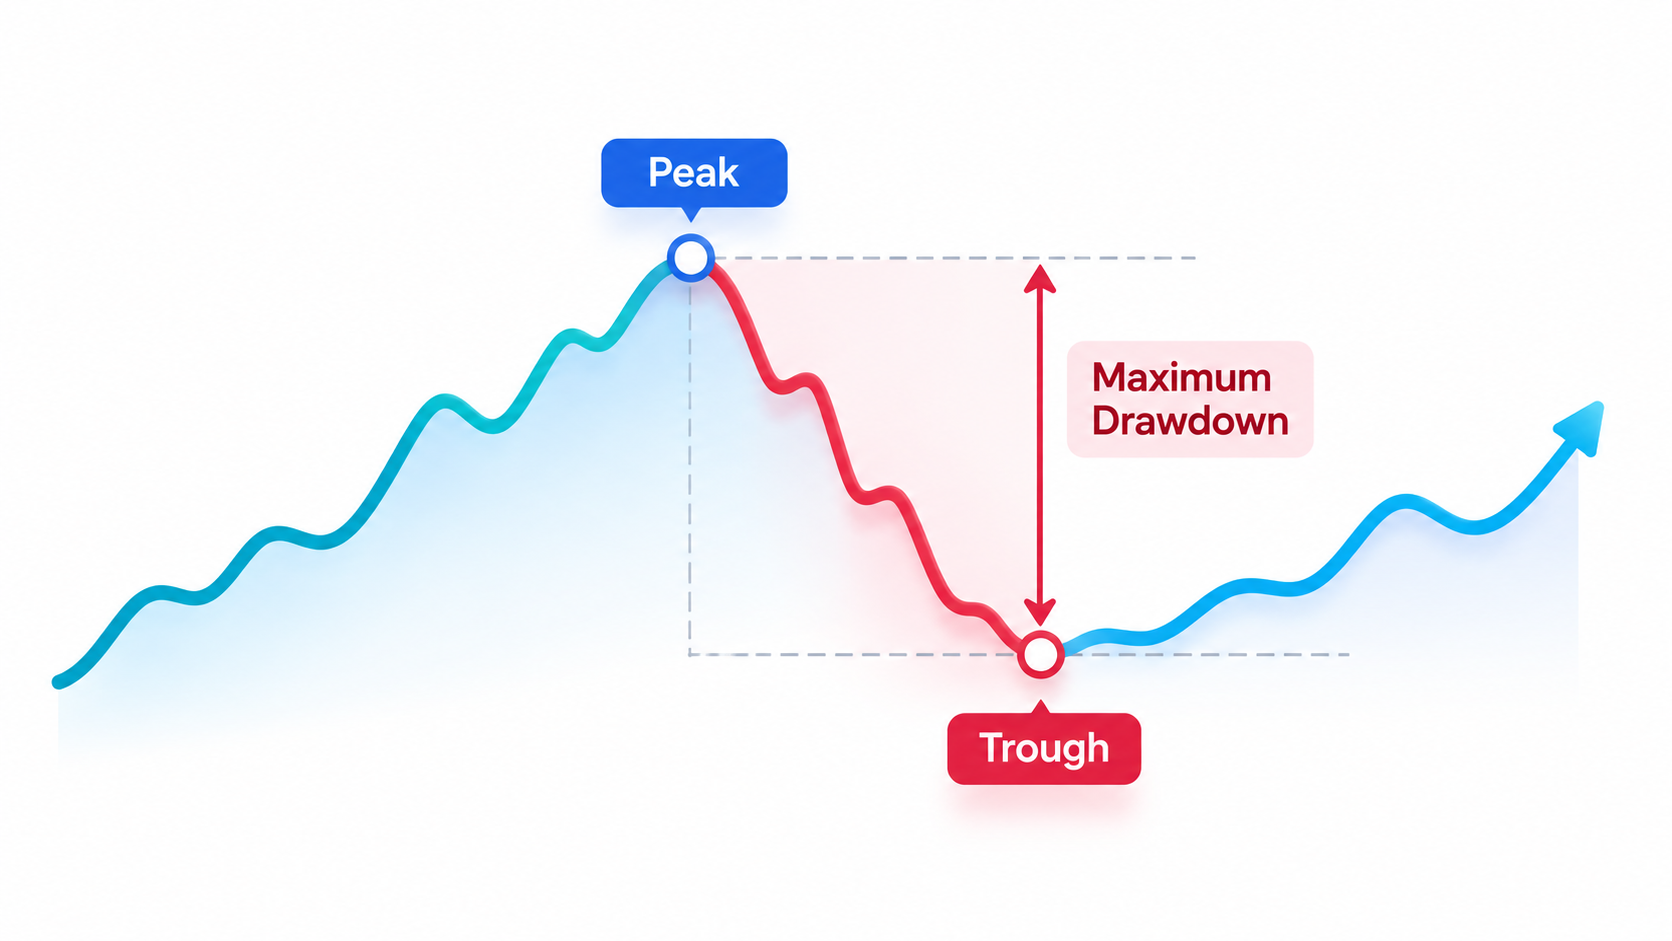
Maximum drawdown (MDD) is the largest peak-to-trough decline recorded within a specified measurement period. It is commonly used to evaluate the historical downside experienced by a trading account or strategy.
Consider three independent hypothetical peak-to-trough declines, each calculated separately:
|
Decline |
Peak |
Trough |
Drawdown |
|
First |
£10,000 |
£9,000 |
10% |
|
Second |
£11,000 |
£8,800 |
20% |
|
Third |
£9,500 |
£8,550 |
10% |
Of these three illustrative declines, the largest is 20%, calculated from £11,000 to £8,800. For a continuous account history, maximum drawdown must account for the highest relevant peak and all subsequent lows within the measurement period.
Maximum drawdown provides information about the worst historical decline within the selected period. However, it does not establish the maximum loss a strategy could experience in the future. Market conditions can change, and historical performance cannot guarantee future results.
When reviewing maximum drawdown, traders should also consider how long the account took to recover, how frequently losses occurred, and whether the measurement includes open-position losses.
How Does Drawdown Affect Trading Performance?
Drawdown affects trading performance in two important ways: it reduces available capital and increases the percentage gain required to recover a loss.
The second effect is particularly important because recovery percentages are calculated from the reduced account value, rather than the original peak.
Understanding the Recovery Percentage
The recovery formula is:
Required Recovery (%) = [Drawdown Amount ÷ Remaining Capital] × 100
Equivalently, if drawdown is expressed as a percentage of the previous peak:
Required Recovery (%) = [Drawdown (%) ÷ (100 − Drawdown (%))] × 100
The following hypothetical examples illustrate the relationship:
|
Drawdown |
Remaining Capital |
Gain Required to Recover |
|
10% |
90% |
11.11% |
|
20% |
80% |
25% |
|
30% |
70% |
42.86% |
|
40% |
60% |
66.67% |
|
50% |
50% |
100% |
For example, a 30% drawdown reduces an account from £10,000 to £7,000. To return to £10,000, the account must gain £3,000, which represents approximately 42.86% of the remaining £7,000.
These figures are mathematical illustrations, not forecasts of trading performance. They also exclude additional deposits, withdrawals, and trading costs.
Drawdown and Trading Psychology
Drawdown can also affect decision-making. After a series of losses, a trader may feel pressure to recover the account quickly and increase position sizes or trade more frequently.
However, increasing exposure to compensate for previous losses can magnify subsequent losses. A more disciplined approach involves reviewing the original trading plan, checking whether its assumptions remain valid, and avoiding decisions driven solely by the desire to recover capital.
Explore account information
Review account details, terms, and risks on the official CPT website.
Common Types of Drawdowns
The term drawdown can refer to several measurements. Understanding the distinction helps traders interpret performance reports accurately.
· Absolute drawdown: The decline below a specified initial account value or starting capital level. Its precise definition should be checked in the reporting methodology.
· Relative drawdown: The percentage decline from a previous peak to a subsequent trough.
· Maximum drawdown: The largest peak-to-trough decline recorded during a defined period.
· Current drawdown: The decline from the relevant previous peak to the latest measured account value.
These terms are not always implemented identically across trading platforms, performance reports, or strategy-testing tools. Therefore, traders should review the calculation method before comparing results.
Risk Controls That Can Help Manage Drawdown
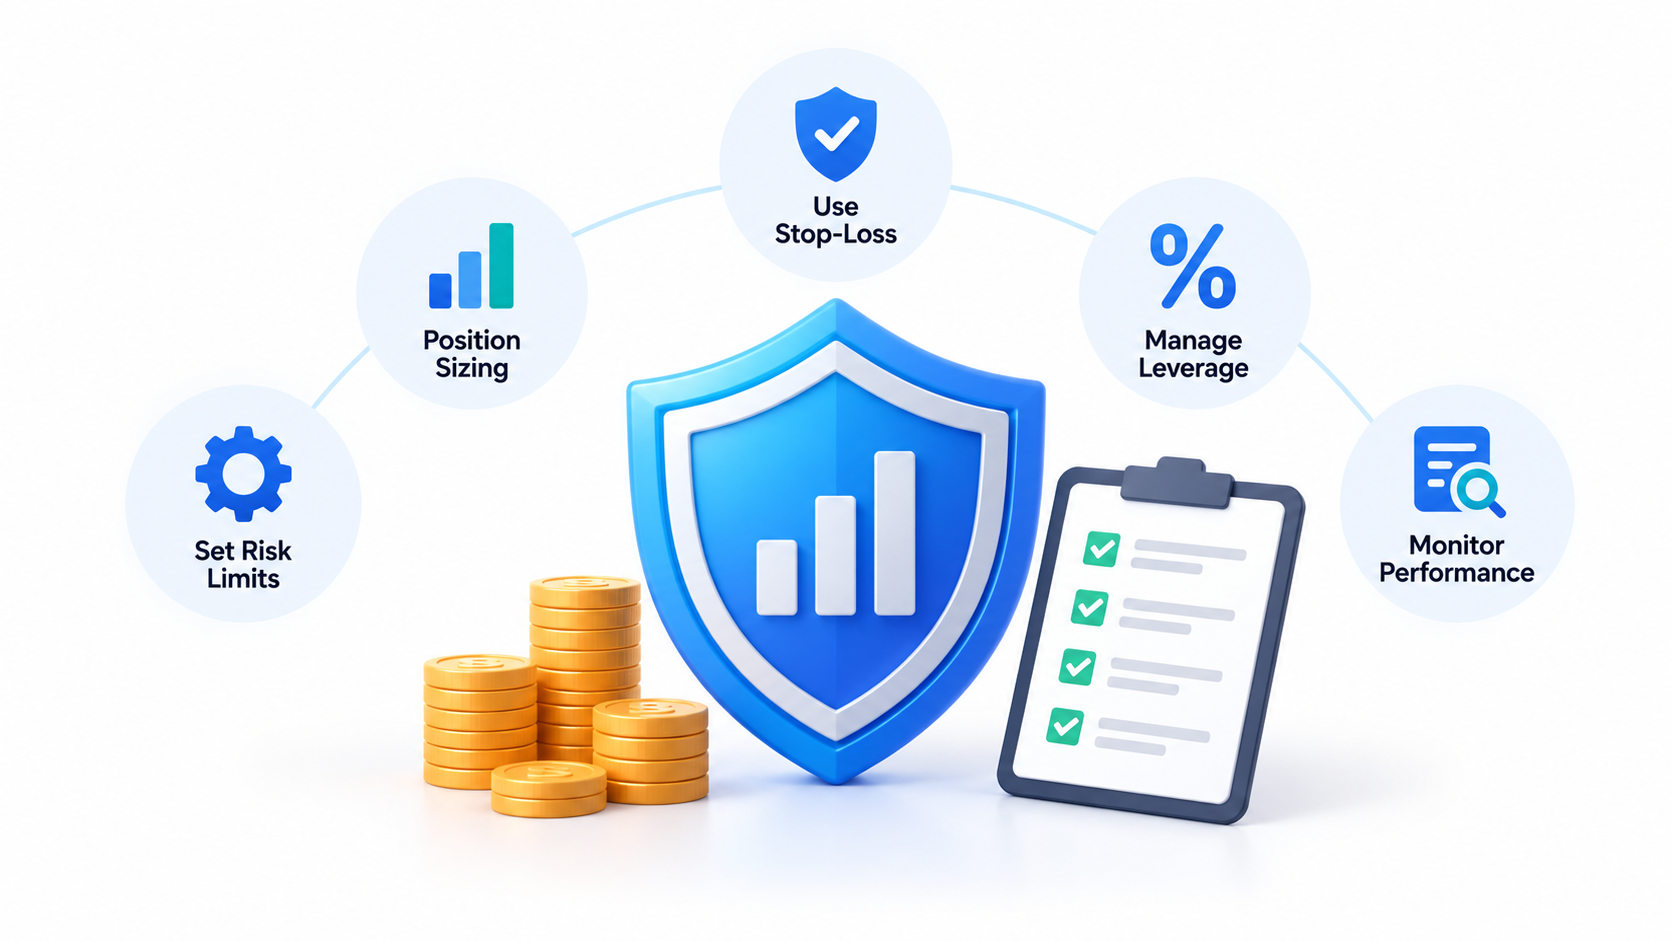
Risk controls aim to limit exposure and establish a consistent process for managing losses. They cannot eliminate market risk or guarantee that drawdown will remain below a particular threshold.
1. Define Risk Limits Before Trading
A trading plan can specify maximum acceptable losses per trade, per day, or over a longer period. It can also establish conditions for pausing trading and reviewing performance.
For example, a hypothetical plan might require a review after the account declines by a predefined percentage from its latest peak. The threshold should be treated as a planning parameter, not a universal rule suitable for every trader.
2. Use Position Sizing to Control Exposure
Position sizing determines how much market exposure a trade carries. It can take account of the intended stop-loss distance, the monetary value of a price movement, and the amount of capital allocated to the trade.
A larger position can produce larger gains when a trade moves favourably, but it can also magnify losses when the market moves against the position.
For this reason, traders can estimate the potential loss at a planned exit level before entering a position. Nevertheless, the actual loss may differ because of gaps, slippage, execution conditions, or other costs.
3. Understand Stop-Loss Orders and Their Limitations
A stop-loss order can help traders define an intended exit level when a position moves against them. However, it does not guarantee execution at the specified price in all market conditions.
Fast-moving markets, price gaps, and limited liquidity may affect the final execution price. Consequently, a stop-loss order should form part of a broader risk-management process rather than serve as a guarantee against excessive drawdown.
4. Monitor Leverage and Margin
Leverage allows traders to control a position with a smaller amount of capital than its full market value would otherwise require. However, it can magnify the effect of adverse price movements on account equity.
Margin is the amount of capital required to open or maintain a leveraged position. It is not the same as the maximum amount a trader can lose. Depending on the product, account terms, and applicable protections, losses may exceed the margin initially allocated to a position.
5. Track Equity and Review Trading Results
Monitoring account equity alongside balance can help reveal unrealised losses before positions close. A trading journal can provide additional context by recording entry and exit levels, position sizes, planned risk, realised results, and the reasons for each trade.
Regular reviews can help identify whether losses are concentrated in particular instruments, market conditions, or trading behaviours. However, past patterns do not necessarily predict future results.
6. Diversify Exposure Where Appropriate
Holding several positions does not automatically reduce risk. Positions in different instruments may respond to the same economic developments or share similar underlying exposures.
Therefore, traders should consider the combined risk of open positions rather than evaluating each trade in isolation. Diversification may reduce certain concentrations, but it cannot eliminate market risk or prevent all positions from losing value at the same time.
How to Interpret Drawdown When Comparing Trading Strategies
Drawdown is most informative when considered alongside other performance measures. A strategy with a high historical return may also have experienced substantial losses along the way.
When comparing strategies, consider the following:
· Maximum drawdown: What was the largest recorded peak-to-trough decline?
· Recovery time: How long did the account take to regain its previous peak, if it recovered?
· Frequency of losses: How often did losing periods occur?
· Trading costs: Were spreads, commissions, financing charges, and other applicable costs included?
· Measurement period: Were the strategies assessed over comparable periods and market conditions?
· Testing limitations: Were results based on historical data, simulated trades, or live trading?
Back-tested results may not reflect the execution conditions or market behaviour encountered in live trading. In addition, a strategy that recovered from a historical drawdown may experience a larger or longer decline in the future.
A balanced assessment therefore considers both returns and the risks taken to achieve them. Drawdown is one useful measure within that assessment, not a complete measure of trading quality.
Conclusion
Drawdown measures how far an account falls from a previous peak and helps quantify the downside experienced during a trading period. The formula is straightforward, but interpreting the result requires attention to account equity, measurement periods, and the difference between historical losses and future risk.
By setting loss limits, controlling position sizes, monitoring equity, and reviewing performance consistently, traders can build a more structured approach to risk management. Nevertheless, no method can eliminate trading risk or guarantee a particular drawdown level.
Frequently Asked Questions
1. What Is a Good Drawdown Percentage in Trading?
There is no universally appropriate drawdown percentage for every trader or strategy. Acceptable levels depend on factors such as trading objectives, risk tolerance, strategy characteristics, and available capital. Historical drawdown can help evaluate downside exposure, but it cannot establish a safe threshold or guarantee that future losses will remain within the same range.
2. What Is the Difference Between Drawdown and Loss?
A trading loss describes a negative financial result from a trade or group of trades. Drawdown measures the decline in account value from a previous peak to a subsequent low. Therefore, drawdown can include several losses and may also reflect unrealised losses on open positions when the calculation uses account equity.
3. How Do You Calculate Maximum Drawdown?
Identify each relevant account peak and the subsequent trough, then calculate the percentage decline from the peak. The largest peak-to-trough percentage decline within the selected measurement period is the maximum drawdown. The result depends on the period and whether the calculation uses balance, equity, or another defined performance measure.
4. Can a Trading Account Recover From Drawdown?
An account can recover if subsequent net gains restore its value to the previous peak. However, the required percentage gain is larger than the original drawdown percentage because the remaining capital is smaller. Recovery is not guaranteed, and additional losses, trading costs, or withdrawals can increase the amount or time required.
5. Does a Stop-Loss Order Prevent Drawdown?
No. A stop-loss order can help define an intended exit level and manage exposure, but it cannot eliminate drawdown. Market gaps, slippage, and execution conditions can cause a trade to close at a different price from the requested stop level. Other open positions can also continue to affect account equity.
6. Is Drawdown the Same as Margin Call?
No. Drawdown measures a decline in account value, while a margin call or margin-related notification concerns an account’s ability to meet applicable margin requirements. A drawdown may contribute to a margin shortfall, but the relevant thresholds, procedures, and possible position closures depend on the product, provider, account terms, and jurisdiction.
Explore account information
Review account details, terms, and risks on the official CPT website.
Related articles
- Forex essentials
Base Currency vs Quote Currency: How Forex Pairs Are Read
A currency pair shows the value of one currency relative to another. The base currency is the first currency in the pair, while the quote currency is the second. The exchange rate tells you how many units of the quote currency are needed to buy one u
12 min read · estimated↗ - Trading essentials
What Is a Trader? Types, Skills, and How Trading Works
A trader is an individual who buys and sells financial instruments or takes positions in financial products to seek profits from changes in market prices. Traders operate across markets such as foreign exchange (forex), shares, indices, commodities,
13 min read · estimated↗ - Digital assets
What Is Litecoin (LTC)? How It Works, Uses, and Risks
Litecoin (LTC) is a decentralised cryptocurrency designed to enable peer-to-peer transactions without requiring a central authority to process them. Launched in 2011, it uses a public blockchain and a proof-of-work consensus mechanism to record trans
12 min read · estimated↗