

Academy
What Is Swing Trading? Strategy, Indicators, and Examples
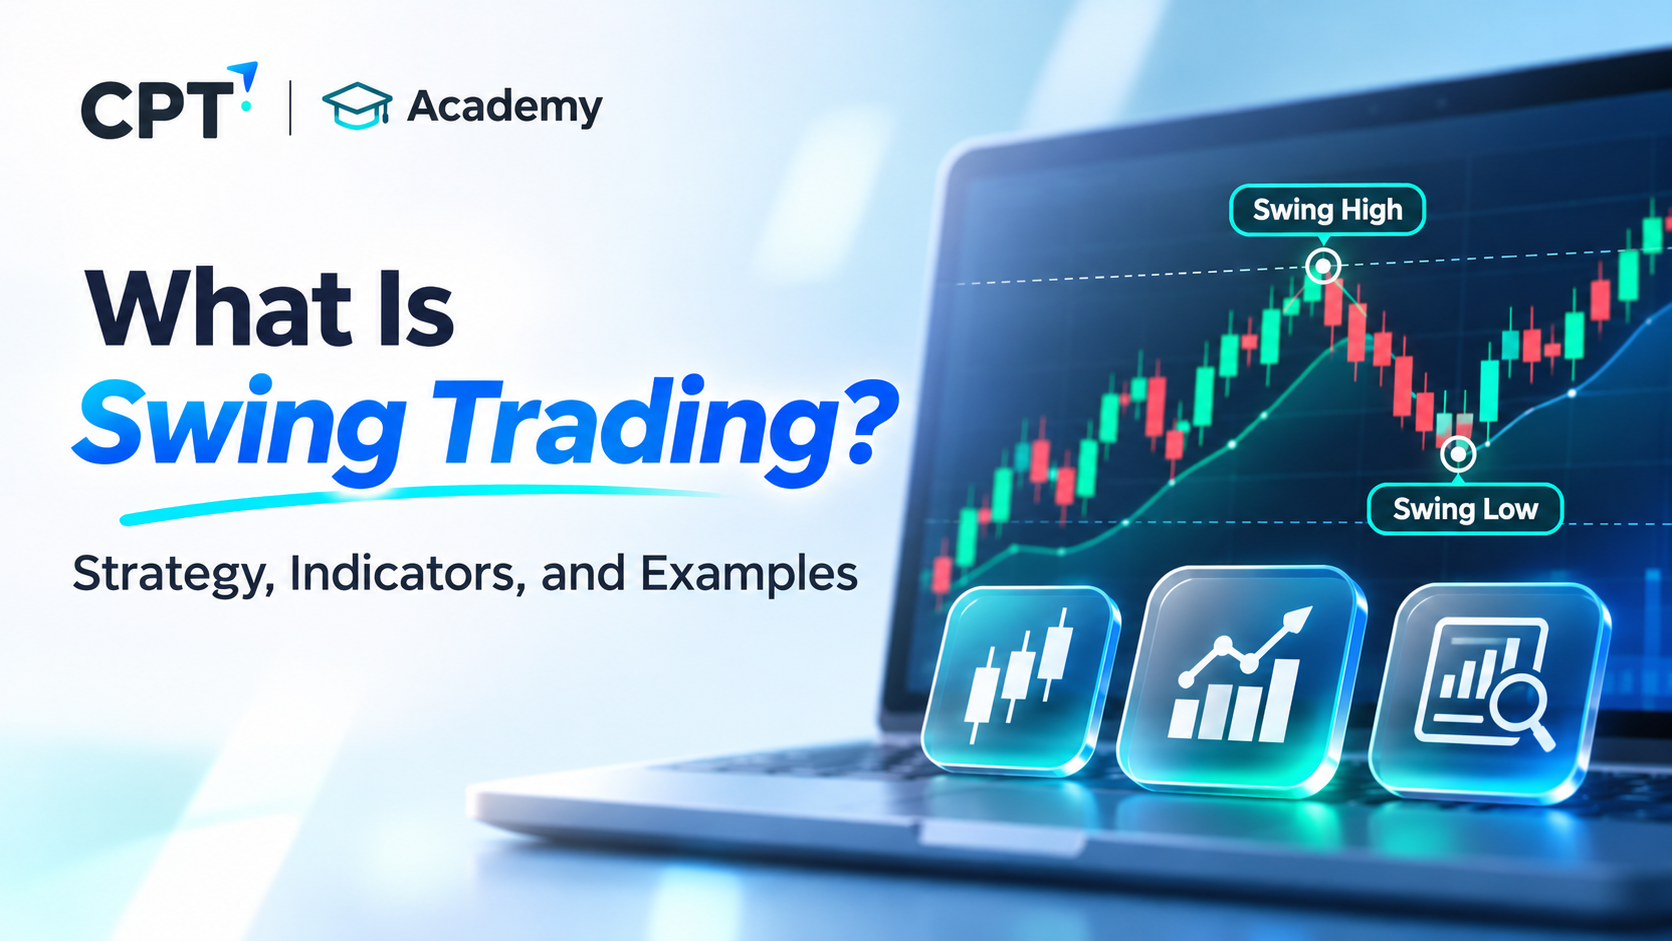
Swing trading is a trading style that aims to capture price movements over several days or weeks. Rather than opening and closing positions within a single trading session, swing traders hold positions while a market develops a short-term upward or downward movement. They typically use technical analysis, chart patterns, and indicators to identify potential entry and exit points. However, holding positions overnight or over weekends exposes traders to additional market risks, including price gaps and unexpected market movements outside regular trading hours.
How Does Swing Trading Work?
Financial markets rarely move in a straight line. Even when an asset follows a broader upward or downward trend, its price may experience temporary rallies, pullbacks, and periods of consolidation.
Swing traders attempt to identify these shorter-term movements, commonly called swings, and capture part of the price movement before the market reverses or their predefined exit conditions are met.
For example, a trader analysing an asset in an established uptrend might wait for its price to retreat towards a support area before considering a long position. If the price subsequently rebounds, the trader may aim to close the position near a previous resistance level or another predefined exit point.
In a declining market, the approach can work in the opposite direction. A trader may look for a temporary upward correction before considering a short position, provided the instrument and account allow short selling.
A typical swing trading process involves:
1. Identifying the Market Trend: Analyse price charts to determine whether the market is moving upwards, downwards, or sideways.
2. Finding a Potential Setup: Look for pullbacks, breakouts, support and resistance levels, or other technical patterns.
3. Confirming the Opportunity: Use indicators and price action to assess whether the setup meets predefined trading conditions.
4. Planning the Trade: Determine a potential entry price, stop-loss level, and profit target before entering.
5. Monitoring the Position: Review price developments and relevant market events while the position remains open.
6. Closing the Trade: Exit when the target is reached, the original trading conditions are invalidated, or the predefined exit rules require it.
Importantly, these steps provide a framework rather than a reliable prediction of future price movements. Technical signals can fail, and a market can move against a position even when the original analysis appears reasonable.
Swing Trading vs Day Trading vs Position Trading
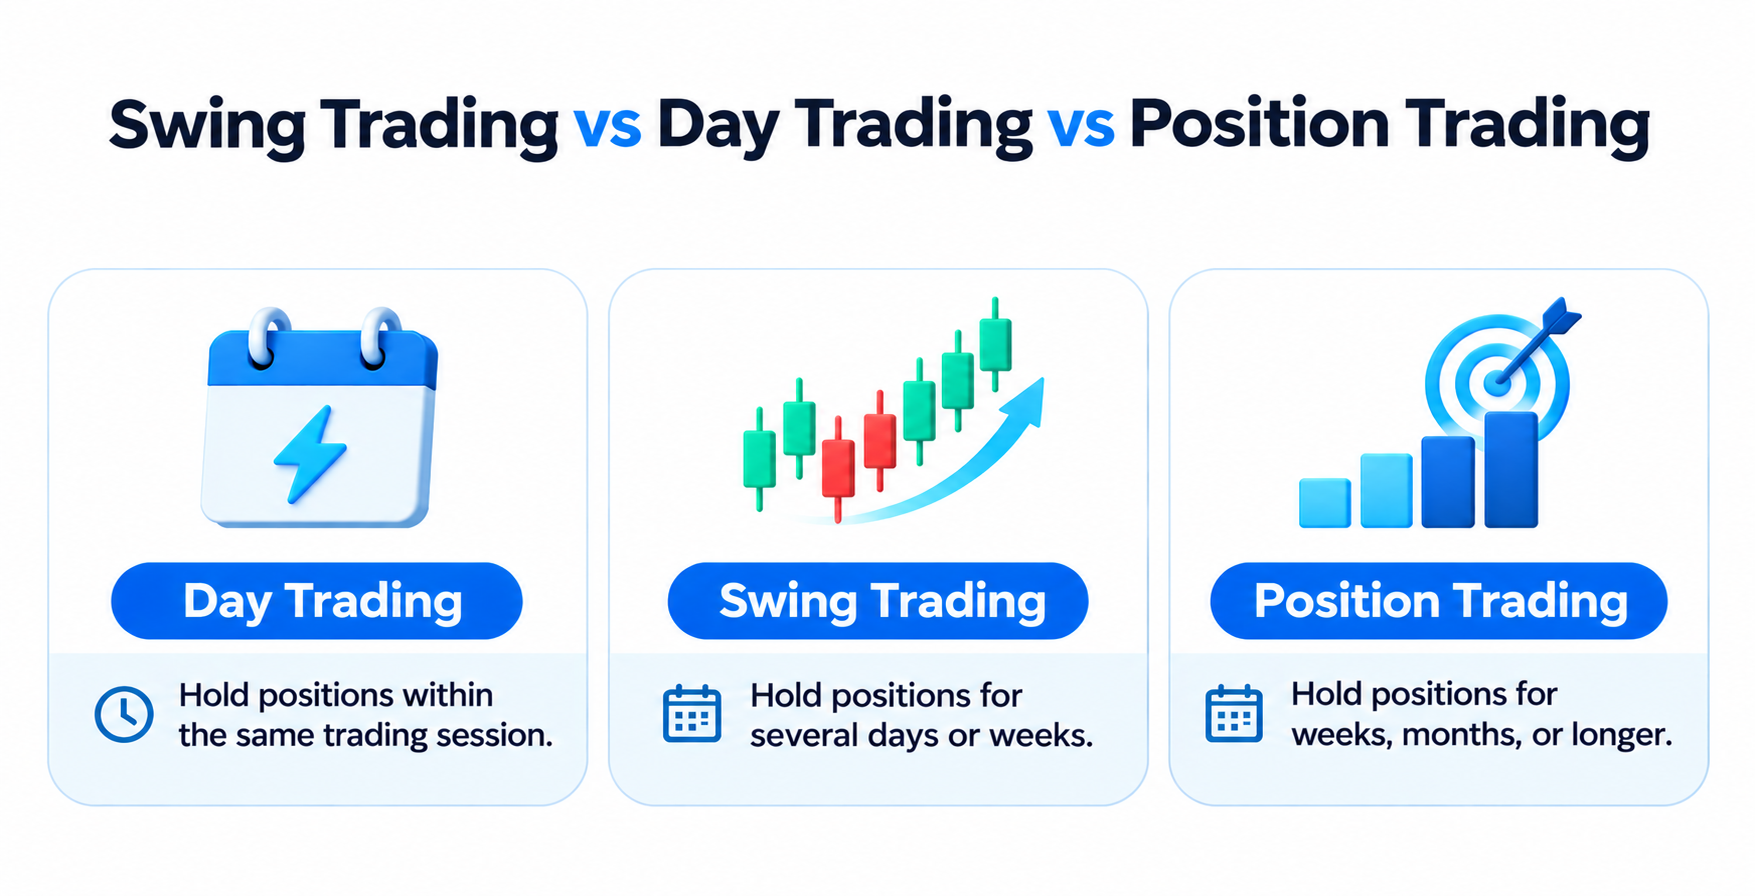
Swing trading is one of several trading styles distinguished primarily by how long traders hold their positions.
The appropriate timeframe depends on the trader’s objectives, available time, approach to market analysis, and tolerance for risk. However, no trading style is inherently more profitable than another.
|
Feature |
Day Trading |
Swing Trading |
Position Trading |
|
Typical Holding Period |
Minutes to Hours |
Several Days to Weeks |
Weeks to Months or Longer |
|
Main Focus |
Intraday Price Movements |
Short-Term Market Swings |
Longer-Term Market Trends |
|
Common Analysis |
Technical Analysis |
Technical and Fundamental Analysis |
Fundamental and Technical Analysis |
|
Overnight Exposure |
Generally Avoided |
Yes |
Yes |
|
Monitoring Frequency |
Often Frequent |
Periodic Monitoring |
Less Frequent |
|
Main Consideration |
Intraday Volatility |
Price Reversals and Overnight Gaps |
Longer-Term Market Changes |
Day Trading involves opening and closing positions within the same trading session. Therefore, day traders generally avoid holding positions overnight, although they may face considerable intraday volatility and execution risks. Different foreign exchange (forex) day trading strategies may approach short-term market movements differently, depending on market conditions and trading objectives.
Swing Trading involves holding positions over several days or weeks. Traders may hold positions through multiple trading sessions, allowing a setup more time to develop. However, they remain exposed to price movements outside regular trading hours.
Position Trading focuses on broader market trends over longer periods. Position traders may consider economic developments, monetary policy, company performance, and other fundamental factors alongside technical analysis.
Common Swing Trading Strategies
Swing traders use different approaches depending on market conditions and their interpretation of price movements. Three commonly discussed strategies are trend-following, pullback trading, and breakout trading.
1. Trend-Following Strategy
Trend-following involves identifying an established market direction and looking for opportunities to trade in line with it.
In an upward trend, prices generally form higher highs and higher lows. Conversely, a downward trend is characterised by lower highs and lower lows.
A swing trader may use moving averages (MAs) to assess the broader direction before looking for an entry opportunity. For instance, a price trading above a rising moving average may support a bullish trend assessment, although this does not guarantee that the trend will continue.
The same principle applies to downward trends, where traders may look for opportunities to trade in the direction of declining prices.
Main Consideration: Trends can reverse without warning. Therefore, traders need predefined exit conditions rather than assuming that an established direction will continue.
2. Pullback Trading Strategy
A pullback occurs when an asset temporarily moves against its prevailing trend.
In an upward market, a pullback involves a short-term price decline within the broader bullish trend. In a downward market, it involves a temporary price increase within the broader bearish trend.
Swing traders may look for these movements to identify potential entry points at more favourable price levels.
For example, a trader might observe an upward trend and wait for the price to approach a previous support area. They may then examine momentum indicators and subsequent candlestick formations for signs that buying pressure is returning.
However, a pullback can develop into a full trend reversal. A support level may also fail to hold, resulting in further losses for traders who enter too early.
Main Consideration: A temporary price correction should not automatically be interpreted as a continuation signal. Traders need additional confirmation and a clear invalidation level.
3. Breakout Trading Strategy
Breakout trading focuses on price movements beyond established support or resistance levels.
A bullish breakout occurs when the price moves above a resistance area, while a bearish breakout happens when it falls below support.
Swing traders may interpret these movements as potential signs that the market is beginning a new directional move. They might enter after the breakout or wait for the price to retest the breached level, which may act as support after a bullish breakout or resistance after a bearish breakout.
Trading volume can provide additional context. For example, a breakout accompanied by increasing volume may indicate stronger participation, although volume interpretation varies between markets and instruments.
One important risk is a false breakout. This happens when the price briefly moves beyond a key level but subsequently returns to its previous trading range.
Main Consideration: Entering immediately after every breakout can expose traders to false signals. Waiting for confirmation may help establish a clearer setup, but it can also mean entering at a less favourable price.
Which Indicators Do Swing Traders Use?
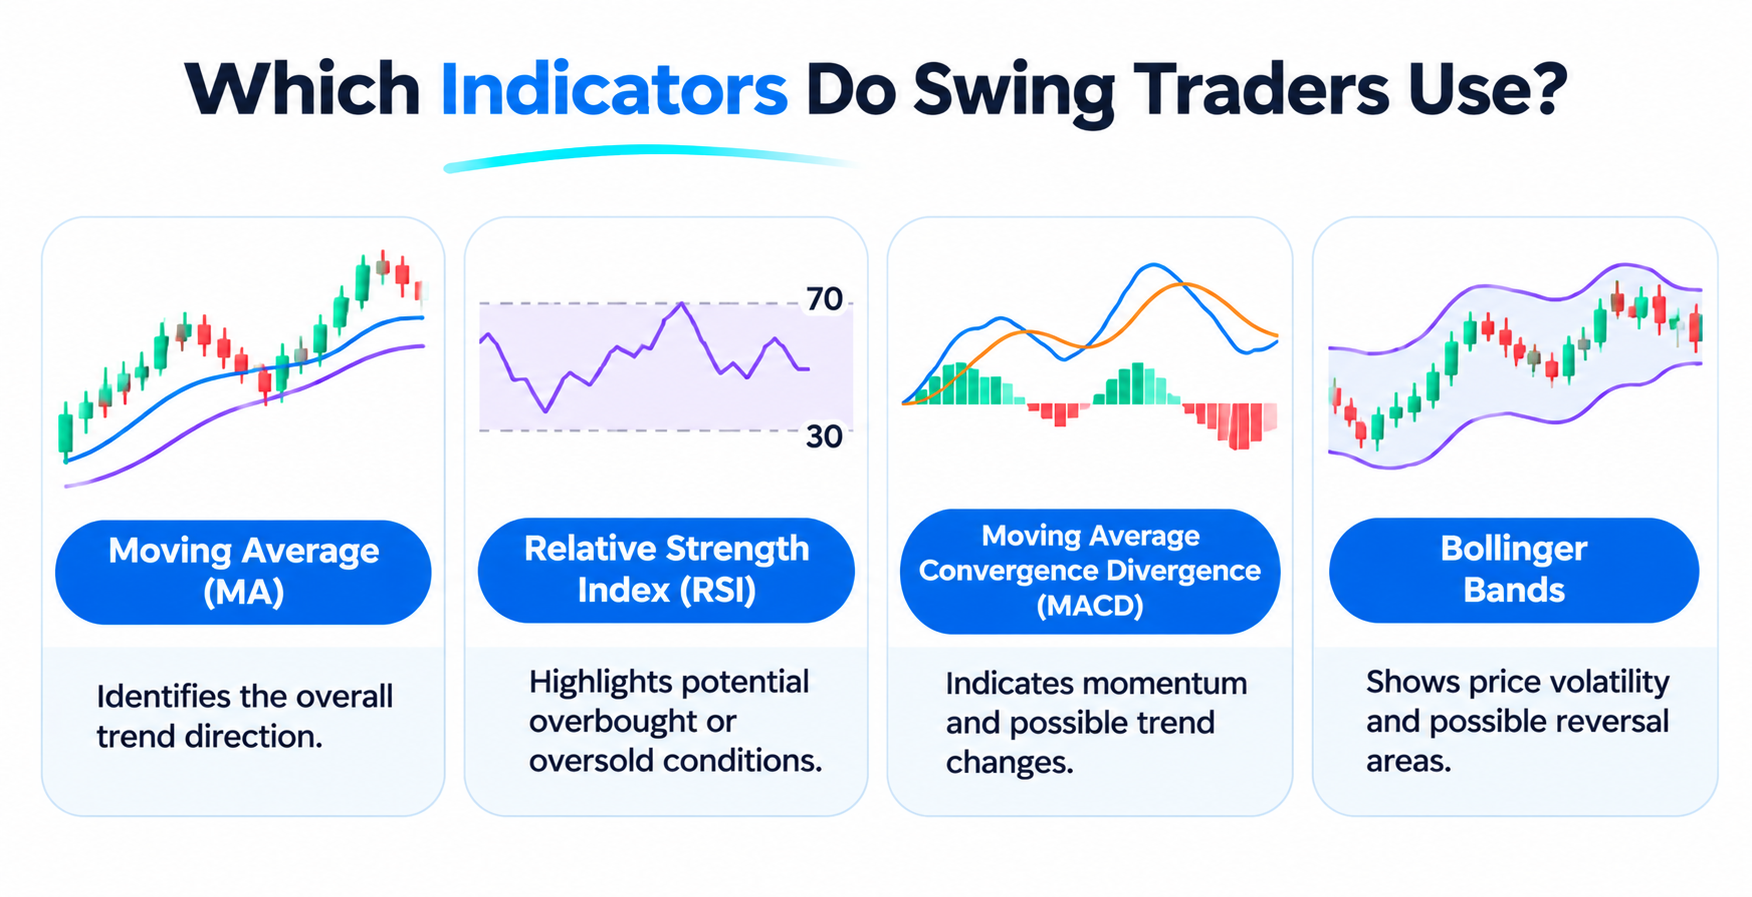
Technical indicators help traders interpret price behaviour by presenting information about trends, momentum, or volatility. They are particularly useful when analysing daily and four-hour charts, although the appropriate timeframe depends on the strategy.
No indicator can predict market movements with certainty. Therefore, traders often combine indicators with price action and support and resistance analysis rather than relying on a single signal.
1. Moving Averages (MAs)
A moving average calculates the average price of an asset over a selected number of periods. It smooths short-term price fluctuations, making the broader market direction easier to assess.
Two commonly used types are:
· Simple Moving Average (SMA): Calculates the arithmetic mean of the selected price data over a specified number of periods, commonly using closing prices.
· Exponential Moving Average (EMA): Gives greater weight to recent prices, making it more responsive to recent market movements.
For example, a trader might use a 20-period EMA to observe shorter-term momentum and a 50-period SMA to assess the broader trend.
However, MAs are lagging indicators. They reflect historical prices and may produce delayed signals, particularly when the market moves sideways.
2. Relative Strength Index (RSI)
The RSI is a momentum oscillator that measures the speed and magnitude of recent price movements. It operates on a scale from 0 to 100.
Traditionally:
· RSI above 70 is associated with potentially overbought conditions.
· RSI below 30 is associated with potentially oversold conditions.
Swing traders may use RSI to identify changes in momentum or assess whether a market has experienced an extended move.
For example, if an asset approaches a support area while its RSI rises from below 30, a trader may investigate whether selling pressure is weakening.
Nevertheless, overbought conditions do not automatically mean that prices will fall, and oversold conditions do not guarantee a rebound. RSI can remain at extreme levels during strong trends.
3. Moving Average Convergence Divergence (MACD)
The MACD indicator examines the relationship between two EMAs to assess changes in momentum.
It typically consists of:
· MACD Line: The difference between the 12-period and 26-period EMAs.
· Signal Line: A nine-period EMA of the MACD line.
· Histogram: Displays the difference between the MACD line and signal line, helping traders assess changes in the distance between them.
A bullish crossover occurs when the MACD line moves above its signal line, potentially indicating strengthening upward momentum. Conversely, a bearish crossover occurs when it moves below the signal line.
Swing traders may use these crossovers to support their analysis of potential entry and exit points.
However, MACD can generate repeated or misleading signals in sideways markets. It is therefore useful to consider the broader price structure before interpreting a crossover as a trading opportunity.
4. Bollinger Bands
Bollinger Bands are volatility indicators consisting of three lines:
· A middle band, usually a 20-period SMA.
· An upper band, typically positioned two standard deviations above the middle band.
· A lower band, typically positioned two standard deviations below the middle band.
The bands expand when volatility increases and contract when volatility decreases.
Swing traders may examine price interactions with the bands to assess market conditions. For example, narrowing bands may indicate declining volatility, although they do not reliably predict when volatility will increase or which direction prices will move.
However, a price touching the upper band does not automatically indicate a selling opportunity. Similarly, touching the lower band does not necessarily mean that the market will rebound.
Practical Tip: Rather than adding every available indicator to a chart, consider using a small combination that serves different purposes. For example, MAs can help assess trend direction, while RSI can provide additional information about momentum.
How to Manage Risk When Swing Trading
Swing trading offers opportunities to analyse price movements over several sessions. However, holding positions overnight or through weekends introduces risks that traders who close positions within the same session may avoid.
A sound risk-management process should address the potential downside before a position is opened.
1. Set a Stop-Loss Level
A stop-loss order is designed to trigger the closing of a position when the market reaches a specified stop price, helping traders manage potential losses.
Swing traders may use technical levels, such as support or resistance, to identify where their original trading idea would become invalid.
For example, a trader considering a long position near support might place a stop-loss below the relevant support area.
A stop-loss order does not guarantee execution at the specified price. Market gaps and slippage may result in execution at a different price, potentially increasing the final loss.
For more information about different order types and their limitations, read our guide to stop-loss orders.
2. Consider Position Sizing
Position sizing determines the amount of market exposure associated with a trade. It is an important part of risk management because the same price movement can produce very different financial outcomes depending on position size.
A simplified calculation is:
Position Size = Planned Monetary Risk ÷ Planned Loss Per Unit
For example, if a hypothetical trader sets a maximum planned loss of USD 50 and the distance between the entry price and stop-loss represents USD 5 per unit, the calculated position size would be 10 units.
This simplified calculation excludes additional costs and assumes execution at the planned stop level. Actual results may differ.
For forex and CFD trading, the calculation may also depend on contract specifications, pip or point values, and currency conversion. Traders should account for these factors when determining their actual position size.
3. Understand Overnight and Weekend Risks
Unlike day traders, swing traders commonly keep positions open beyond the end of a trading session.
Consequently, economic announcements, central bank decisions, geopolitical developments, and unexpected events can affect prices while a trader is not actively monitoring the market.
Furthermore, prices may reopen at a different level from the previous closing price, creating a market gap. If the market moves beyond a stop-loss level during the gap, the order may be executed at a less favourable price.
4. Account for Trading Costs
Holding a position for several days may involve costs beyond the initial transaction.
Depending on the instrument and product, these may include spreads, commissions, and overnight financing charges or swaps.
For contracts for difference (CFDs), overnight financing is particularly relevant because financing charges, or any applicable credits, can affect the overall result of a position held for multiple sessions.
The specific costs depend on the instrument, account terms, and applicable product conditions. Traders should review the relevant contract specifications before opening a position.
5. Monitor Market Fundamentals
Although swing trading often relies heavily on technical analysis, fundamental developments can influence price movements over several days or weeks.
For example, interest rate decisions, inflation releases, employment reports, and corporate earnings announcements may affect market expectations and volatility.
A technical setup may therefore change when significant new information enters the market. Monitoring the economic calendar and relevant market developments can provide additional context.
6. Maintain a Trading Journal
Recording trading decisions can help traders review their strategies and identify recurring mistakes.
A trading journal may include:
· Instrument and trading direction.
· Entry and exit prices.
· Chart timeframe and technical indicators used.
· Stop-loss and take-profit levels.
· Planned and realised risk.
· Reasons for entering and exiting the position.
· Lessons from the trade.
Over time, these records can help traders assess whether their approach follows a consistent process.
Swing Trading Example: A Hypothetical Trade
The following example illustrates how a trader might combine trend analysis, technical indicators, and risk management when planning a swing trade.
Suppose an asset is trading in an established upward trend. After analysing its daily chart, a hypothetical trader identifies a potential support area around USD 100.
The price subsequently retreats towards this level. The trader observes that the RSI is recovering from a lower reading and that a bullish candlestick forms near support.
Rather than assuming that the price must rise, the trader uses these observations to assess a possible long setup.
The following figures are illustrative only:
|
Trading Parameter |
Hypothetical Value |
|
Instrument Price at Entry |
USD 102 |
|
Stop-Loss Level |
USD 98 |
|
Take-Profit Target |
USD 110 |
|
Position Size |
10 Units |
|
Planned Risk per Unit |
USD 4 |
|
Planned Reward per Unit |
USD 8 |
|
Potential Loss Before Costs |
USD 40 |
|
Potential Gain Before Costs |
USD 80 |
The hypothetical risk-to-reward ratio is:
Risk-to-Reward Ratio = Planned Risk : Planned Reward = 4:8 = 1:2
This means the planned potential reward is twice the planned potential loss, assuming execution at the specified levels.
Scenario A: The Market Moves in the Expected Direction
If the asset reaches USD 110 and the position closes at the target, the hypothetical gross gain would be:
(110 – 102) × 10 = USD 80
Scenario B: The Market Moves Against the Position
If the asset reaches USD 98 and the position closes at the stop level, the hypothetical gross loss would be:
(102 – 98) × 10 = USD 40
These calculations exclude spreads, commissions, financing charges, and slippage. They also assume that the relevant exit prices are available.
The example demonstrates how swing traders can establish entry conditions and define potential outcomes before opening a position. It does not demonstrate that the strategy will achieve a particular success rate or produce a positive return.
Advantages and Disadvantages of Swing Trading
Swing trading has characteristics that may appeal to some traders, but its longer holding periods also introduce specific challenges.
|
Potential Advantages |
Potential Disadvantages |
|
Generally requires less frequent monitoring than day trading |
Positions remain exposed to overnight and weekend market movements |
|
Allows time for multi-timeframe analysis |
Market gaps can affect planned exit levels |
|
Can be applied to different financial markets |
Requires patience while waiting for setups to develop |
|
May involve fewer trades than frequent intraday approaches |
Holding positions can introduce additional financing costs |
|
Combines technical analysis with broader market context |
False signals and unexpected reversals can produce losses |
Ultimately, the suitability of swing trading depends on individual circumstances, market knowledge, available time, and tolerance for risk. A longer holding period does not automatically make a strategy less risky than day trading.
How to Develop a Swing Trading Plan
A trading plan provides a consistent framework for analysing markets and managing positions. Rather than relying on isolated signals, swing traders can establish rules that explain when to enter, when to exit, and when to avoid a trade.
A basic swing trading plan may include:
1. Select a Market: Identify the financial instrument and understand its trading characteristics.
2. Choose a Timeframe: Use a consistent timeframe for analysing the broader trend and identifying potential setups.
3. Define Entry Conditions: Specify the price patterns, technical indicators, or market conditions required before entering.
4. Establish Exit Rules: Determine the conditions for closing a position, including stop-loss and profit-taking levels.
5. Calculate Position Size: Determine the position size based on the planned monetary risk and the distance between the entry price and stop-loss level.
6. Review Performance: Record trades and assess whether the strategy follows its original rules.
A plan should also account for trading costs, overnight exposure, and relevant economic events.
To better understand price movements and chart patterns, explore our guide on how to read forex charts.
What to Remember About Swing Trading
Swing trading aims to capture short-term price movements over several days or weeks. It combines market analysis, technical indicators, and structured trade planning to identify potential opportunities across different financial markets.
Trend-following, pullback trading, and breakout trading are common approaches, while MAs, RSI, MACD, and Bollinger Bands can provide additional information about price behaviour.
However, no strategy or indicator guarantees a successful outcome. Overnight exposure, market gaps, leverage, trading costs, and unexpected price reversals can all result in losses.
Understanding these factors, developing a consistent trading plan, and assessing potential risks before entering a position are essential parts of learning about swing trading.
Frequently Asked Questions
1. What Is Swing Trading in Simple Terms?
Swing trading is a trading style that aims to capture short- to medium-term price movements over several days or weeks. Traders analyse market trends, price patterns, and technical indicators to identify potential entry and exit points. Unlike day traders, swing traders typically hold positions overnight, which exposes them to additional market risks.
2. How Long Do Swing Traders Hold Positions?
Swing traders commonly hold positions for several days to a few weeks, although the exact duration depends on the instrument, strategy, and market conditions. Some trades may close sooner if the original setup becomes invalid, while others may remain open longer if the trading plan allows it.
3. What Are the Best Indicators for Swing Trading?
Commonly used indicators include MAs, RSI, MACD, and Bollinger Bands. Each provides different information about trends, momentum, or volatility. No indicator is universally best, and none can reliably predict future price movements.
4. Is Swing Trading Suitable for Beginners?
Beginners can study and practise swing trading, but they should first understand technical analysis, position sizing, stop-loss orders, and market risk. Holding positions overnight also requires awareness of price gaps and potential financing costs. A clear trading plan and a thorough understanding of the relevant product are important starting points.
5. Is Swing Trading Better Than Day Trading?
Neither approach is inherently better. Swing trading involves holding positions for several days or weeks, whereas day trading generally involves closing positions within the same trading session. Their time requirements and risk exposures differ. The appropriate approach depends on the trader’s knowledge, objectives, available time, and tolerance for market fluctuations.
6. Can Swing Trading Be Used in Forex and CFD Markets?
Swing trading can be applied to different financial markets, including forex, shares, indices, and commodities. It can also be used with CFDs, depending on the products available through the relevant provider and jurisdiction. However, leveraged CFDs carry significant risk, and holding positions overnight may involve additional financing charges.
Explore account information
Review account details, terms, and risks on the official CPT website.
Related articles
- Forex essentials
Base Currency vs Quote Currency: How Forex Pairs Are Read
A currency pair shows the value of one currency relative to another. The base currency is the first currency in the pair, while the quote currency is the second. The exchange rate tells you how many units of the quote currency are needed to buy one u
12 min read · estimated↗ - Trading essentials
What Is a Trader? Types, Skills, and How Trading Works
A trader is an individual who buys and sells financial instruments or takes positions in financial products to seek profits from changes in market prices. Traders operate across markets such as foreign exchange (forex), shares, indices, commodities,
13 min read · estimated↗ - Digital assets
What Is Litecoin (LTC)? How It Works, Uses, and Risks
Litecoin (LTC) is a decentralised cryptocurrency designed to enable peer-to-peer transactions without requiring a central authority to process them. Launched in 2011, it uses a public blockchain and a proof-of-work consensus mechanism to record trans
12 min read · estimated↗