

Technical analysis
How to Read Forex Charts: Types, Trends, and Price Levels

Forex charts show how currency exchange rates change over time. To read them, first understand the chart type and timeframe, then interpret opening and closing prices, identify trends, and mark potential support and resistance levels. These tools help you analyse market behaviour and identify potential price scenarios, but they cannot predict future prices with certainty or eliminate trading risks.
What Is a Forex Chart?
A forex chart is a visual representation of a currency pair’s price movements over a selected period. It typically displays time along the horizontal axis and price along the vertical axis, allowing you to examine how an exchange rate has changed.
For example, an EUR/USD chart shows the value of the euro against the US dollar. A rising exchange rate means one euro buys more dollars, while a falling rate means it buys fewer.
Charts organise price information, allowing traders to use technical analysis to examine trends, recurring patterns, and potential turning points. However, a chart describes recorded price movements; it does not explain every reason behind them or establish what will happen next.
Before analysing a chart, check three key elements:
· Currency pair: Which two currencies does the chart represent?
· Timeframe: Does each candle, bar, or plotted point represent minutes, hours, days, or another interval?
· Price scale: What exchange rate does the vertical axis show, and how is it displayed?
Once you understand these elements, you can interpret the information more consistently.
What Are the Main Types of Forex Charts?
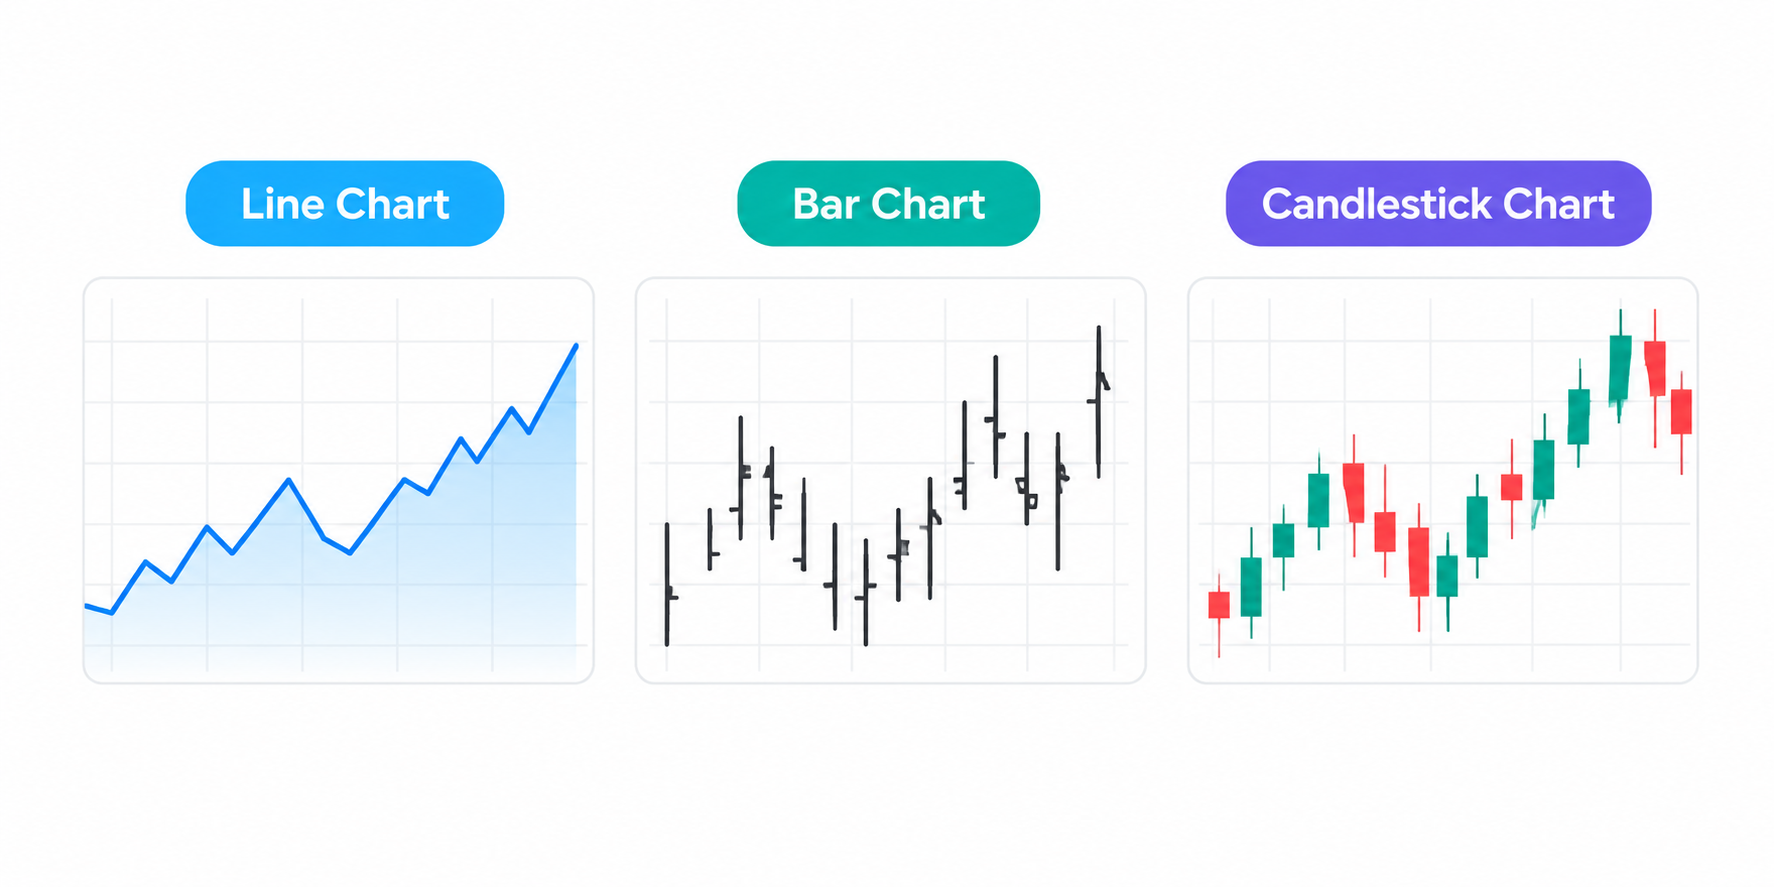
The three main forex chart types are line charts, bar charts, and candlestick charts. Each presents price information differently, so the most useful choice depends on what you want to examine.
1. Line Charts
A line chart connects selected price points, commonly the closing price for each period, to show the overall direction of a currency pair.
Because it displays fewer price details for each period, a line chart provides a relatively uncluttered view of price movements. It can help you recognise a broad trend without becoming distracted by short-term fluctuations.
However, a standard closing-price line does not show each period’s opening price or full high-to-low range, providing less detail about price movements within each period than bar or candlestick charts.
Best use: Reviewing the broader direction of a currency pair and comparing price movements over time.
2. Bar Charts
A bar chart displays four key prices for each period: the opening price, highest price, lowest price, and closing price. These are commonly abbreviated as OHLC (open, high, low, and close).
Each bar consists of a vertical line and two short horizontal ticks:
· High: The highest price reached during the period.
· Low: The lowest price reached during the period.
· Open: The price at the beginning of the period, shown by the left-hand mark.
· Close: The price at the end of the period, shown by the right-hand mark.
The vertical line shows the period’s trading range, while the horizontal ticks indicate the opening and closing prices.
Bar charts provide more detail than line charts, but their appearance may be less intuitive for beginners than candlestick charts, which use wider bodies to display the opening and closing prices.
Best use: Examining the full price range and comparing opening and closing prices across periods.
3. Candlestick Charts
Candlestick charts display the same four core prices as OHLC bar charts, using a rectangular body and thin lines called wicks or shadows to present the information visually.
Each candle has three main elements:
· Body: The range between the opening and closing prices.
· Upper wick: The price range between the top of the body and the period’s high.
· Lower wick: The price range between the bottom of the body and the period’s low.
The candle’s colour typically indicates whether the price closed above or below its opening level. A green or white candle commonly represents a closing price above the opening price, while a red or black candle commonly represents a closing price below the opening price. However, colours vary according to platform settings.
For example, a candle with a large body and short wicks indicates a large difference between the opening and closing prices, with both prices relatively close to the period’s high and low. A candle with a small body and long wicks indicates that the opening and closing prices were relatively close together compared with the period’s full high-to-low range.
Neither shape guarantees a reversal or continuation. Instead, traders interpret candles alongside surrounding price action, market conditions, and other relevant information.
Best use: Studying individual periods, interpreting potential buying and selling pressure from price movements, and identifying possible patterns.
How to Read a Candlestick Chart Step by Step
Candlesticks become easier to interpret when you examine them in a consistent order. Rather than relying on a single candle, consider its context within the wider chart.
Step 1: Check the Timeframe
A timeframe determines how much time each candle represents. On a one-hour chart, each standard time-based candle represents one hour. On a daily chart, each candle represents one daily interval, as defined by the chart’s data feed and session settings.
Shorter timeframes show more detailed short-term price movements, while longer timeframes help reveal the broader market structure. However, the same currency pair can appear to be rising on one timeframe and falling on another.
Step 2: Identify the Open and Close
Examine the candle’s body to identify the opening and closing prices for the period. A close above the open indicates that price rose during that period; a close below the open indicates that it fell.
This comparison describes the period’s movement, not necessarily the wider trend. A bullish candle can appear within a broader downtrend, just as a bearish candle can occur during an uptrend.
Step 3: Examine the Wicks
The wicks show how far price travelled beyond the opening-to-closing range.
For instance, a long upper wick indicates that the period’s high was considerably above the candle’s body, while the closing price remained below that high. This may reflect a pullback from the high, although the wick alone cannot establish why price retreated or whether the move will continue.
Step 4: Compare Nearby Candles
Look for patterns across several candles. Are the bodies generally expanding or shrinking? Are highs moving higher? Are repeated attempts to move beyond a price level failing?
These observations help put individual candles into context, but no pattern reliably predicts future price movements on its own. Its interpretation may also differ across timeframes.
How to Identify Forex Trends
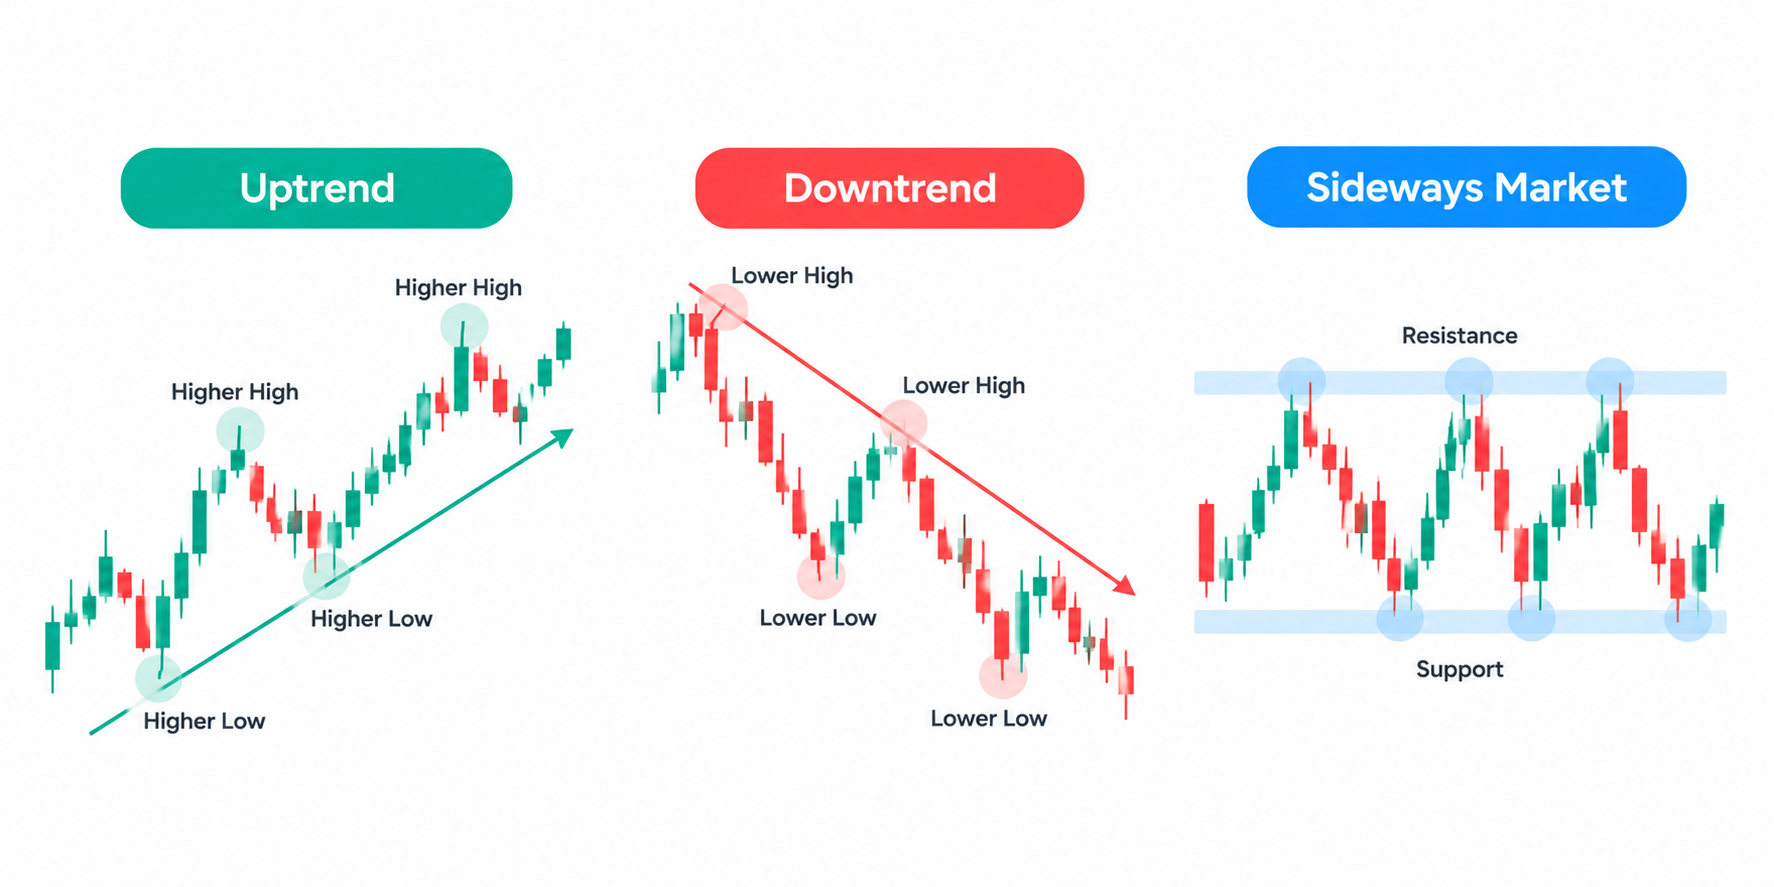
A trend describes the general direction of price movement. Forex charts commonly show three broad conditions: uptrends, downtrends, and sideways markets.
· Uptrend: Price generally makes higher highs and higher lows. Each upward swing reaches a higher peak, while subsequent pullbacks hold above earlier lows.
· Downtrend: Price generally makes lower lows and lower highs. Each downward swing reaches a lower trough, while subsequent rebounds fail to exceed earlier peaks.
· Sideways market: Price moves within a relatively defined range without a clear sequence of higher highs and higher lows or lower highs and lower lows.
These descriptions help you organise price action, but trends are not always clear-cut. Markets can pause, retrace, or change direction, and short-term fluctuations may conflict with the broader trend.
Higher Highs and Higher Lows
Consider a hypothetical EUR/USD chart with the following swing highs and lows:
|
Price Structure |
Example Level |
|
First Swing High |
1.1000 |
|
First Swing Low |
1.0900 |
|
Second Swing High |
1.1100 |
|
Second Swing Low |
1.1000 |
|
Third Swing High |
1.1200 |
The successive swing highs rise from 1.1000 to 1.1100 and then 1.1200, while the second swing low at 1.1000 is higher than the first at 1.0900. Together, these movements are consistent with an uptrend.
Traders may use trendlines to connect successive swing lows in an uptrend or successive swing highs in a downtrend. However, trendlines involve judgement: different traders may draw them differently, and a brief break does not automatically confirm a lasting trend reversal.
Why Timeframe Matters When Identifying Trends
A five-minute chart may show a short-term decline while a daily chart still shows a longer-term uptrend. Neither observation is necessarily wrong; each describes a different period.
Therefore, consider the timeframe that matches the purpose of your analysis. You can also compare a shorter timeframe with a longer one to understand whether recent price action aligns with, or moves against, the broader structure.
Explore account information
Review account details, terms, and risks on the official CPT website.
What Are Support and Resistance Levels?
Support and resistance are price areas where previous movements have slowed, stalled, or reversed. Traders use these areas in technical analysis to identify potential turning points, pullbacks, and breakouts.
· Support is an area where downward movement has previously slowed or reversed.
· Resistance is an area where upward movement has previously slowed or reversed.
These levels are better treated as zones than as perfectly precise prices. Markets can move through them, overshoot them or reverse before reaching them again.
How to Identify Support
Look for areas where price has previously fallen and then rebounded. If several pullbacks have stopped near a similar area, traders may identify that region as potential support.
However, previous buying interest does not guarantee that the level will hold in the future. If price moves below support, the market may continue lower or return to test the area from underneath.
How to Identify Resistance
Look for areas where price has previously risen and then retreated. Repeated failures to move beyond a similar region may indicate potential resistance.
If price moves above the resistance zone, some traders monitor whether the former resistance later acts as support. A brief move above the zone does not necessarily confirm a sustained breakout. This behaviour is possible, but it is not automatic.
Horizontal Levels and Trendlines
Horizontal support and resistance levels mark areas around previous highs and lows. Trendlines, by contrast, connect successive highs or lows to illustrate a potential directional boundary.
For example, a series of rising lows may allow a trader to draw an upward-sloping support trendline. If price later falls below it, the trader may reassess the trend. However, a trendline break alone does not prove that the market has reversed.
How to Combine Trends and Price Levels
Chart analysis becomes more structured when you consider trends and price levels together rather than interpreting each signal in isolation.
Use this process as an educational framework:
1. Start with the broader trend: Determine whether the chart shows higher highs and higher lows, lower highs and lower lows, or a sideways range.
2. Mark previous turning areas: Identify potential support and resistance near earlier swing highs and lows.
3. Observe the response: If price approaches a marked area, examine whether it pauses, reverses, or moves through it.
4. Review the candle context: Consider the candle bodies, wicks, and surrounding price structure rather than relying on one isolated candle.
5. Reassess the chart: If price breaks an important level or the trend structure changes, review your original interpretation.
For example, imagine that EUR/USD forms higher highs and higher lows, then breaks above a previous swing high. If price subsequently pulls back towards that level and holds above it, the former resistance area may act as support. Alternatively, a sustained move back below the area could suggest that the previous upward structure is weakening.
Both outcomes remain possible. The example illustrates how traders organise chart information, not a forecast or a trading recommendation.
Common Mistakes When Reading Forex Charts
Several habits can make chart analysis less reliable. Recognising them helps you separate observation from assumption.
· Relying on one candle: A single candle rarely provides enough context to establish a trend or reversal.
· Ignoring the timeframe: Short-term movements can conflict with longer-term price structure.
· Treating support and resistance as exact: Price levels are approximate areas, and the market may move beyond them.
· Drawing too many lines: Excessive indicators and price levels can obscure the chart rather than clarify it.
· Assuming past patterns will repeat: Historical price behaviour does not guarantee future outcomes.
· Ignoring market fundamentals: Interest-rate expectations, inflation data, employment reports, and other economic developments can influence exchange rates and trigger rapid price movements.
Technical analysis is one way to examine markets, but it is not a substitute for understanding the risks of the product being traded. Leveraged forex and CFD positions can magnify losses as well as potential gains.
How Beginners Can Practise Reading Forex Charts
A useful starting point is to practise describing what a chart shows before attempting to interpret what might happen next.
Choose a currency pair and a timeframe. Identify the most recent candles, describe the overall trend, and mark a small number of potential support and resistance areas. Then observe how price behaves around those areas over time.
Keep a simple record of your observations. Note what you expected to see, what happened next, and whether your original interpretation depended on assumptions that the chart did not support.
You can also review the same currency pair across different timeframes to see how its apparent trend changes with perspective. This exercise can improve your understanding of market structure without requiring you to place a trade.
Explore more educational resources through the CPT Markets Academy to build your understanding of forex terminology and market analysis. Before using any trading product, review the applicable terms, risks, and product documentation for the relevant entity and jurisdiction.
Risk Warning: Forex and CFD trading involve significant risk and may not be suitable for all investors. Leverage can magnify both gains and losses. Understanding charts does not guarantee profitable outcomes.
Frequently Asked Questions
1. What Is the Best Forex Chart Type for Beginners?
Candlestick charts are a useful starting point because they display opening, closing, high, and low prices in a visual format. Line charts can make broader trends easier to see, while bar charts provide the same core OHLC information as candlesticks. The most suitable chart depends on what you want to analyse, and none can reliably predict future prices.
2. How Do You Know if a Forex Trend Is Up or Down?
An uptrend generally features higher highs and higher lows, while a downtrend generally features lower highs and lower lows. A sideways market lacks a clear sequence in either direction. These patterns describe price structure but do not guarantee future price movements.
3. What Is the Difference Between Support and Resistance?
Support is a price area where downward movement has previously slowed or reversed, while resistance is an area where upward movement has previously slowed or reversed. Traders use these zones to study potential turning points and breakouts. However, neither level is guaranteed to hold, and prices can move through them.
4. Which Timeframe Should Beginners Use to Read Forex Charts?
There is no single timeframe that suits every learner or trading approach. Longer timeframes can make broad trends easier to identify, while shorter timeframes show more detailed price fluctuations. Beginners can compare multiple timeframes to understand how market structure changes with perspective. A shorter timeframe also does not necessarily provide more reliable signals.
5. Can Forex Charts Predict Future Prices?
No. Forex charts show historical and current price information, while technical analysis identifies patterns and scenarios that traders may consider. These patterns can fail, and unexpected economic data or market developments can cause rapid price movements. Chart analysis therefore cannot guarantee an outcome or remove the financial risks associated with trading.
6. What Should You Look for First When Reading a Forex Chart?
Start by checking the currency pair, timeframe, and price scale. Next, identify the broad trend and examine recent opening, closing, high, and low prices. Finally, mark a few potential support and resistance areas. This sequence provides a structured way to describe price action before considering any interpretation or trading decision.
Explore account information
Review account details, terms, and risks on the official CPT website.
Related articles
- Forex essentials
Base Currency vs Quote Currency: How Forex Pairs Are Read
A currency pair shows the value of one currency relative to another. The base currency is the first currency in the pair, while the quote currency is the second. The exchange rate tells you how many units of the quote currency are needed to buy one u
12 min read · estimated↗ - Trading essentials
What Is a Trader? Types, Skills, and How Trading Works
A trader is an individual who buys and sells financial instruments or takes positions in financial products to seek profits from changes in market prices. Traders operate across markets such as foreign exchange (forex), shares, indices, commodities,
13 min read · estimated↗ - Digital assets
What Is Litecoin (LTC)? How It Works, Uses, and Risks
Litecoin (LTC) is a decentralised cryptocurrency designed to enable peer-to-peer transactions without requiring a central authority to process them. Launched in 2011, it uses a public blockchain and a proof-of-work consensus mechanism to record trans
12 min read · estimated↗