

Academy
How to Keep a Trading Journal: Metrics, Template, and Examples
A trading journal is a record of your trading activity, including the reasons behind each decision, entry and exit details, financial results, and lessons learned. By maintaining one consistently, you can evaluate your trading performance, identify recurring mistakes, measure how well you follow your strategy, and make more informed decisions about your approach.
However, a useful trading journal does more than record profits and losses. It helps you understand the decisions behind each outcome, including what worked, what did not, and whether you followed your original trading plan.
What Is a Trading Journal?
A trading journal is a structured record of your trading decisions and their outcomes. It documents the circumstances surrounding each trade, from the initial market analysis and entry rationale to the final result and subsequent review.
Unlike a basic transaction history, which primarily shows executed orders and financial results, a trading journal also captures the reasoning behind your actions.
For example, you might record:
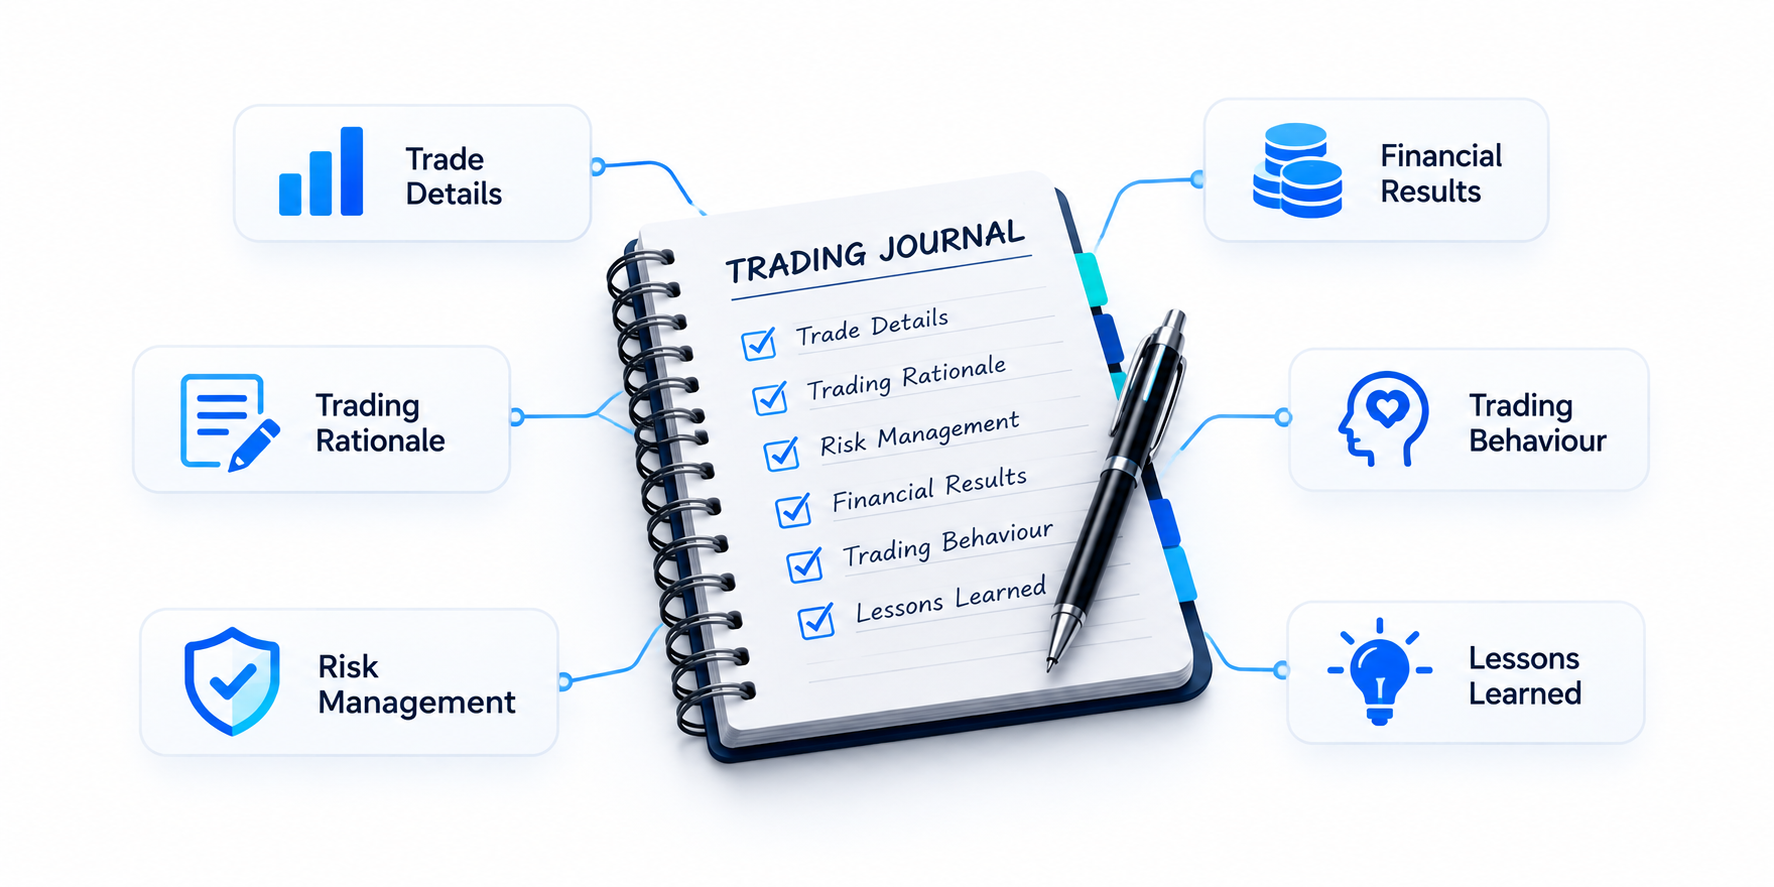
· Trade Details: The instrument, trading direction, entry and exit prices, position size, and holding period.
· Trading Rationale: Why you entered the position and which market conditions supported your decision.
· Risk Management: Your planned risk, stop-loss level, and intended exit conditions.
· Financial Results: Gross profit or loss, transaction costs, and net profit or loss.
· Trading Behaviour: Whether you followed your strategy, experienced emotional pressure, or deviated from your original plan.
· Post-Trade Review: What you learned and whether any adjustments deserve further consideration.
Over time, these records provide a clearer picture of your trading habits and performance.
Why Is Keeping a Trading Journal Important?
Trading decisions involve more than identifying potential market opportunities. Your results can also depend on position sizing, risk management, execution, transaction costs, and the discipline with which you follow your strategy.
A trading journal helps you examine these factors using your own trading records rather than relying on memory or isolated experiences.
1. Identify Strengths and Weaknesses
Recording your trades allows you to examine which strategies, instruments, and market conditions have produced different outcomes.
For instance, you might discover that your trading decisions have been more consistent during specific market sessions. Alternatively, your records might reveal that you frequently enter positions too early or close profitable trades before reaching their planned exit levels.
These observations can help you identify areas that deserve further attention.
2. Evaluate Your Trading Strategy
A strategy should be assessed using a collection of trades rather than a few individual outcomes.
By tracking relevant performance metrics, you can examine whether your approach has produced consistent results across a defined sample. You can also compare performance across different market conditions and identify situations in which your strategy has struggled.
Nevertheless, historical performance does not guarantee future results. A strategy that performed well during one market environment may produce different outcomes when conditions change.
For example, different forex day trading strategies may produce different results depending on market conditions and the rules used to enter and exit trades.
3. Improve Risk Management
A journal provides a record of how much risk you intended to take and what actually happened.
For example, you can compare your planned loss with your realised loss, examine whether you followed your stop-loss rules, and identify situations in which you increased your exposure without sufficient justification.
This distinction matters because a profitable trade does not necessarily represent a good decision if it involved excessive risk or a departure from your trading plan.
4. Recognise Emotional Trading Patterns
Emotions can influence decisions, particularly after a series of losses or during periods of rapid price movements.
Recording your emotional state before and after each trade can help reveal behavioural patterns.
You might notice that you trade more frequently after losing positions, enter trades because of fear of missing out (FOMO), or abandon your exit rules when a position moves against you.
Recognising these patterns is an important step towards developing a more consistent decision-making process.
What Should You Record in a Trading Journal?
The information in your journal should be detailed enough to support meaningful analysis without making the process unnecessarily complicated.
A practical starting point is to organise your records into three categories: trade information, performance data, and behavioural observations.
1. Essential Trade Information
These fields establish what happened during each trading position.
|
Metric |
What to Record |
|
Trade ID |
A unique reference for each trade |
|
Entry Date and Time |
The exact date and time when the position was opened |
|
Exit Date and Time |
The exact date and time when the position was closed |
|
Instrument |
The financial instrument traded |
|
Direction |
Buy or sell |
|
Entry Price |
The actual average entry price |
|
Exit Price |
The actual average exit price |
|
Position Size |
The quantity or contract size |
|
Stop-Loss |
The original planned stop-loss level |
|
Take-Profit |
The intended profit-taking level, if applicable |
|
Holding Period |
How long the position remained open |
Where possible, record actual execution details rather than relying exclusively on intended order prices.
2. Risk and Performance Information
These fields help you evaluate the financial outcome and the risk involved.
|
Metric |
What to Record |
|
Planned Risk |
The estimated monetary risk before entering |
|
Gross Profit or Loss |
The financial result before applicable trading costs |
|
Transaction Costs |
Spreads, commissions, financing charges, and other applicable costs |
|
Net Profit or Loss |
The financial result after applicable costs |
|
Risk-to-Reward Ratio |
The planned potential risk relative to potential reward |
|
R-Multiple |
The realised result expressed as a multiple of initial risk |
For leveraged products, including contracts for difference (CFDs), record the relevant contract specifications and costs. Leverage can magnify both gains and losses, so the initial margin should not be confused with the total market exposure.
3. Strategy and Behavioural Information
Financial results alone cannot explain every trading decision.
Consider adding the following observations:
· Entry Rationale: Why did the trading opportunity meet your strategy criteria?
· Market Conditions: Were there important economic announcements, strong trends, or unusual volatility?
· Strategy Compliance: Did you follow your predefined entry and exit rules?
· Emotional State: Were you calm, impatient, frustrated, or overly confident?
· Mistakes: Did you enter too early, increase your position size, or close the trade prematurely?
· Lessons Learned: What would you retain or reconsider if a similar situation occurred again?
You can also attach screenshots of the relevant price chart before entry and after closing the position. These provide additional context when reviewing your decisions.
Important Trading Performance Metrics to Track
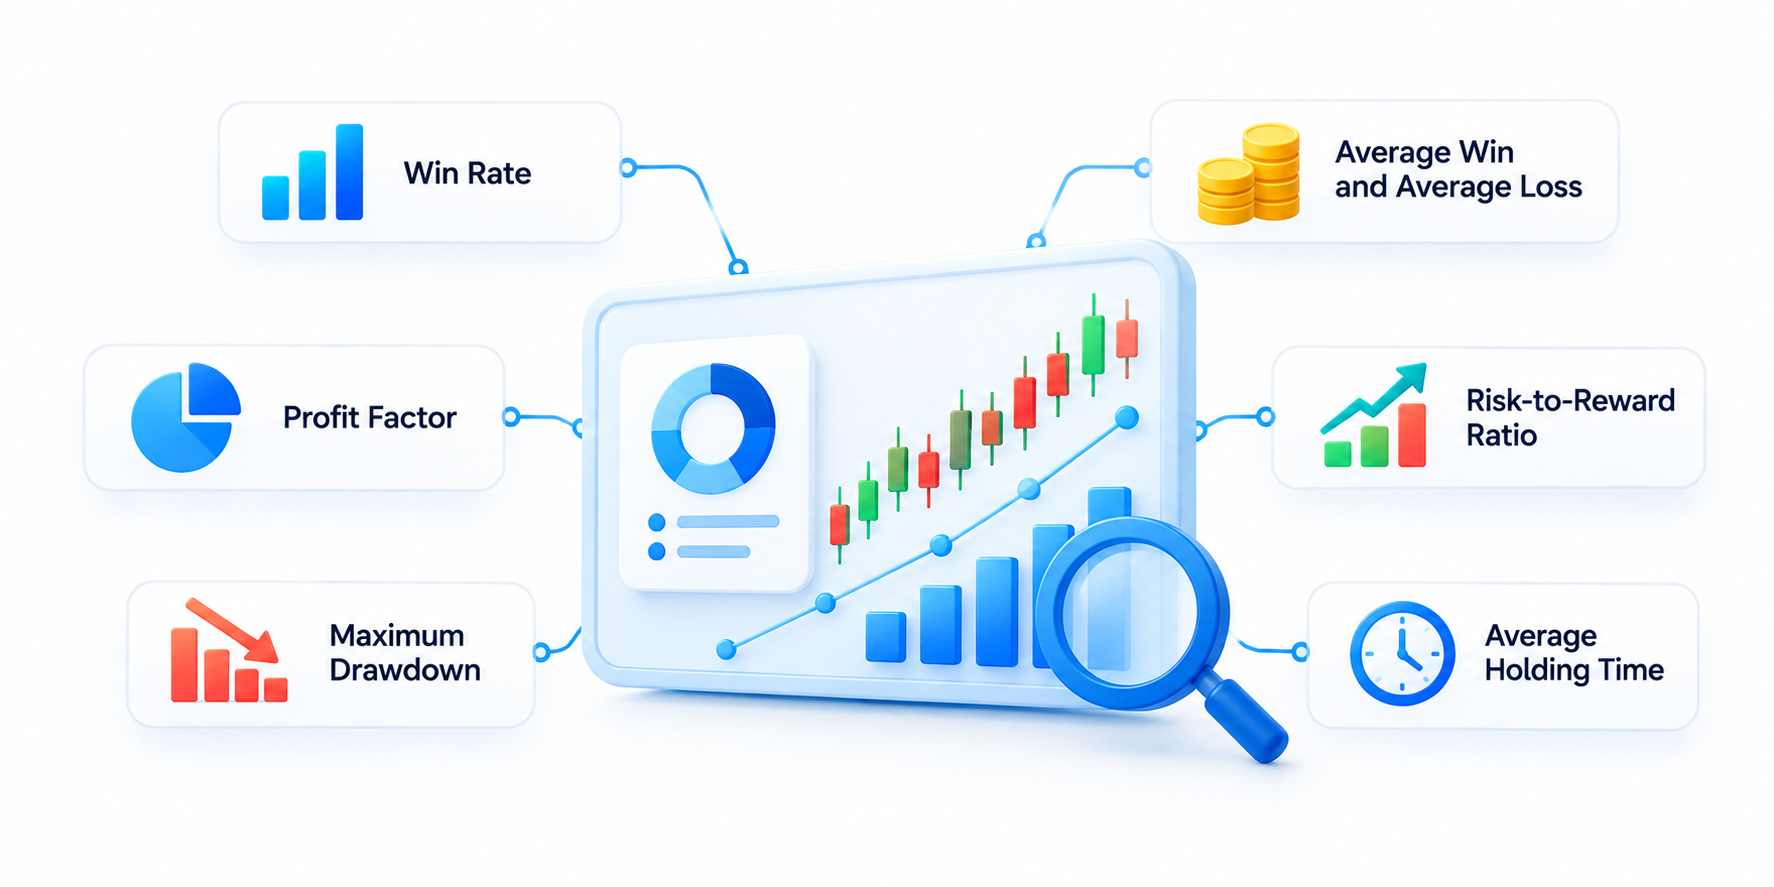
Once you have collected enough trading records, you can calculate several metrics to assess your performance.
The following measurements provide different perspectives. No single metric can determine whether a trading strategy is suitable or likely to remain profitable.
1. Win Rate
Win rate measures the percentage of completed trades that generated a positive net result. Break-even trades are included in the total number of completed trades but are not counted as winning trades.
Formula:
Win Rate = (Number of Winning Trades ÷ Total Number of Trades) × 100
Hypothetical Example:
Suppose you complete 40 trades, of which 24 generate a net profit.
Win Rate = (24 ÷ 40) × 100 = 60%
Your win rate is therefore 60%.
However, a high win rate does not automatically indicate a profitable strategy. The average size of winning and losing trades also matters.
2. Average Win and Average Loss
These metrics show how much you typically gain from winning trades and lose from unsuccessful ones.
Formulas:
Average Net Win = Total Net Profit from Winning Trades ÷ Number of Winning Trades
Average Net Loss = Absolute Total Net Loss from Losing Trades ÷ Number of Losing Trades
Hypothetical Example:
Suppose your trading records show:
· Total profit from winning trades: USD 1,200
· Number of winning trades: 24
· Total loss from losing trades: USD 800
· Number of losing trades: 16
Your calculations are:
· Average Win = USD 1,200 ÷ 24 = USD 50
· Average Loss = USD 800 ÷ 16 = USD 50
In this example, your average winning and losing trades have the same monetary value.
Comparing these figures with your win rate provides a more complete view of your trading results.
3. Profit Factor
Profit factor compares the total gross profit from winning trades with the absolute total gross loss from losing trades.
Formula:
Profit Factor = Gross Profit ÷ Absolute Gross Loss
Hypothetical Example:
Suppose your records show USD 1,500 in gross profits and USD 1,000 in gross losses.
Profit Factor = USD 1,500 ÷ USD 1,000 = 1.5
This means your gross profits are 1.5 times your gross losses during the measured period.
A gross profit factor above 1 indicates that gross profits exceeded gross losses in the sample. However, this calculation does not account for transaction costs. If costs are deducted, the resulting net profit factor provides a different measure of performance. It also does not establish that future performance will be similar.
4. Risk-to-Reward Ratio
The risk-to-reward ratio compares the potential loss with the potential gain planned before entering a trade.
Formula:
Reward-to-Risk Multiple = Potential Reward ÷ Potential Risk
Hypothetical Example:
Suppose you plan to risk USD 100 on a trade, with a potential reward of USD 200.
Risk-to-Reward Ratio = USD 200 ÷ USD 100 = 2
A reward-to-risk multiple of 2 is equivalent to a planned risk-to-reward ratio of 1:2.
Remember that this is a planned measurement, not a prediction of the actual outcome. Execution prices, market conditions, and transaction costs can change the realised result.
5. Maximum Drawdown
Maximum drawdown measures the largest percentage decline from a previous account equity peak to a subsequent trough during a specified period.
Simplified Formula:
Maximum Drawdown = [(Peak Equity − Trough Equity) ÷ Peak Equity] × 100
Hypothetical Example:
Suppose your account equity reaches a peak of USD 5,000 before declining to a subsequent trough of USD 4,500. If this is the largest peak-to-trough decline during the measured period:
Maximum Drawdown = [(5,000 − 4,500) ÷ 5,000] × 100 = 10%
The drawdown is 10%.
Tracking this metric helps you understand the extent of historical declines in your trading equity. It does not indicate how much you could lose in the future.
For a deeper understanding, read our guide to drawdown in trading, including its formula, examples, and risk controls.
6. Average Holding Time
Average holding time measures how long you typically keep positions open.
Formula:
Average Holding Time = Total Holding Time of Completed Trades ÷ Number of Completed Trades
This metric can help you examine whether your actual trading behaviour matches your intended approach.
For example, if your strategy is designed around short-term price movements but your records show that you regularly hold losing positions much longer than planned, you may need to investigate why.
How to Keep a Trading Journal Step by Step
You do not need an advanced spreadsheet or specialised software to start recording your trades. A simple spreadsheet, notebook, or dedicated journaling application can provide a useful foundation.
Follow these steps to establish a consistent routine.
Step 1. Choose Your Trading Journal Format
First, select a format that you can maintain consistently.
Common options include:
· Spreadsheet: Microsoft Excel or Google Sheets allows you to organise trade information, apply formulas, and calculate performance metrics.
· Trading Journal Software: Dedicated applications may offer automated trade imports, performance dashboards, and analytical tools.
· Notebook: A traditional journal can be useful for recording market observations, emotional responses, and personal reflections.
For beginners, a spreadsheet is often a practical starting point because it allows you to customise the information you record.
Step 2. Record Your Trading Plan Before Entry
Before opening a position, document the reason for considering the trade.
Include the instrument, trading direction, market conditions, entry criteria, planned stop-loss, potential exit, and estimated risk.
Recording this information beforehand helps preserve your original reasoning. Otherwise, it can be tempting to reinterpret a decision after knowing its outcome.
Step 3. Document Actual Trade Execution
Once your position has been opened, record the actual entry price, position size, and execution time.
After closing the position, add the actual exit price, realised result, and applicable transaction costs.
If your execution differed from the original plan, explain why.
Step 4. Review Your Trading Decisions
After each trading session, examine your completed positions.
Ask yourself:
· Did the trade meet my strategy criteria?
· Did I follow my original risk management rules?
· Were my entry and exit decisions consistent with my plan?
· Did emotions influence my decisions?
· Were the results affected by unexpected market conditions?
Importantly, distinguish between a losing trade that followed your rules and a profitable trade that involved poor decision-making.
Step 5. Analyse Your Results Regularly
Review your journal weekly or monthly, depending on how frequently you trade.
Look for recurring patterns in your win rate, average win, average loss, profit factor, and maximum drawdown.
Avoid changing your entire strategy after one unsuccessful trade. Instead, examine a meaningful sample and investigate whether the evidence supports a specific adjustment.
If you decide to change your approach, document the reason and evaluate the revised rules separately.
Trading Journal Template: A Practical Example
The following template provides a starting point for organising your trading records. You can adapt it to your trading strategy, preferred instruments, and level of experience.
|
Field |
Hypothetical Trade Example |
|
Trade ID |
001 |
|
Date |
15 October 2026 |
|
Instrument |
EUR/USD |
|
Direction |
Buy |
|
Entry Price |
1.1000 |
|
Exit Price |
1.1040 |
|
Position Size |
EUR 10,000 |
|
Stop-Loss |
1.0980 |
|
Take-Profit |
1.1040 |
|
Planned Risk |
USD 20 |
|
Gross Profit or Loss |
+USD 40 |
|
Transaction Costs |
USD 2 |
|
Net Result |
+USD 38 |
|
Trading Rationale |
Hypothetical bullish technical setup |
|
Strategy Compliance |
Followed planned entry and exit rules |
|
Emotional State |
Calm |
|
Post-Trade Lesson |
Recorded the trade according to the original plan |
Important: This is an illustrative example using a simplified linear calculation. It assumes a US dollar-denominated account, a EUR/USD position of 10,000 units, and no currency conversion. Actual results depend on contract specifications, execution prices, applicable charges, and other trading conditions.
You can expand this template by adding the performance metrics discussed earlier. However, start with the information you genuinely need rather than creating an unnecessarily complicated record.
Common Trading Journal Mistakes to Avoid
Although maintaining a journal is relatively straightforward, several mistakes can reduce its usefulness.
· Recording Only Profitable Trades: Excluding losing positions creates an incomplete picture of your performance. Record every completed trade, regardless of its outcome.
· Focusing Only on Profit and Loss: Financial results do not explain whether you followed your strategy. Include your original reasoning, risk decisions, and execution details.
· Writing Entries Long After Trading: Relying on memory can lead to inaccurate or incomplete records. Record important information as close to the actual trading activity as practical.
· Tracking Too Many Metrics: An excessive number of fields can make journaling difficult to maintain. Start with essential information and introduce additional measurements when they answer specific questions.
· Ignoring Trading Costs: Gross profit and loss can differ significantly from the final financial result after applicable spreads, commissions, financing charges, and other costs.
· Changing Strategies Too Frequently: Individual wins and losses are not sufficient evidence that a strategy needs to be replaced. Review a meaningful sample before making adjustments.
How Can a Demo Account Help You Practise Trading Journaling?
A Demo Account can provide an environment in which to practise recording trades and reviewing decisions without immediately exposing real capital to market risk.
You can use it to become familiar with your chosen trading platform, practise documenting entry and exit decisions, calculate performance metrics, and develop a consistent journaling routine.
For example, you might record a series of simulated trades over a defined period and evaluate your win rate, average win, average loss, and strategy compliance.
However, simulated trading has limitations. Demo results do not necessarily reflect the emotional pressures, financial consequences, or execution conditions associated with live trading. Therefore, successful simulated results should not be interpreted as evidence of future profitability.
Make Your Trading Journal a Consistent Habit
A trading journal is most useful when it becomes part of your regular trading routine. By recording both the financial results and the decisions behind them, you can develop a more objective understanding of your trading behaviour.
Start with a simple template, track a consistent set of metrics, and review your records at regular intervals. Most importantly, use the information to evaluate your decision-making rather than treating short-term profits as proof that a strategy will continue to perform well.
Trading involves financial risk, and maintaining a journal cannot eliminate losses or guarantee better results. Nevertheless, systematic record-keeping can help you understand your trading activity and make more informed assessments of your approach.
Frequently Asked Questions
1. What Should I Write in a Trading Journal?
Record the instrument, trade direction, entry and exit prices, position size, stop-loss, planned risk, and financial result. You should also document your trading rationale, market conditions, emotional state, strategy compliance, and lessons learned. Including these details allows you to review both financial performance and the decision-making process behind each trade.
2. How Often Should I Update My Trading Journal?
Ideally, record each trade as soon as practical after execution and complete your review at the end of each trading session. You can then conduct a more detailed analysis weekly or monthly to identify recurring patterns. Consistency is more important than writing lengthy entries, so choose a routine that you can maintain.
3. What Is the Best Trading Journal for Beginners?
A spreadsheet created in Microsoft Excel or Google Sheets is a practical starting point for beginners. It allows you to record trade details, calculate performance metrics, and organise your results without requiring specialised software. As your trading activity becomes more complex, you can consider dedicated journaling applications with additional analytical features.
4. Which Trading Performance Metrics Should I Track?
Start with win rate, average win, average loss, profit factor, risk-to-reward ratio, maximum drawdown, and average holding time. These metrics provide different perspectives on your trading performance. However, they should be interpreted together because a high win rate, for example, does not necessarily indicate that your strategy is profitable.
5. Can a Trading Journal Help Me Become a Better Trader?
A trading journal can help you identify recurring mistakes, evaluate strategy compliance, understand risk exposure, and recognise behavioural patterns. However, maintaining one does not guarantee improved performance or profitable results. Its usefulness depends on the accuracy of your records and your willingness to review the evidence objectively.
Explore account information
Review account details, terms, and risks on the official CPT website.
Related articles
- Forex essentials
Base Currency vs Quote Currency: How Forex Pairs Are Read
A currency pair shows the value of one currency relative to another. The base currency is the first currency in the pair, while the quote currency is the second. The exchange rate tells you how many units of the quote currency are needed to buy one u
12 min read · estimated↗ - Trading essentials
What Is a Trader? Types, Skills, and How Trading Works
A trader is an individual who buys and sells financial instruments or takes positions in financial products to seek profits from changes in market prices. Traders operate across markets such as foreign exchange (forex), shares, indices, commodities,
13 min read · estimated↗ - Digital assets
What Is Litecoin (LTC)? How It Works, Uses, and Risks
Litecoin (LTC) is a decentralised cryptocurrency designed to enable peer-to-peer transactions without requiring a central authority to process them. Launched in 2011, it uses a public blockchain and a proof-of-work consensus mechanism to record trans
12 min read · estimated↗